

Researchers recorded data on the amount of sleep reported each night during a week by a random
Question:
Researchers recorded data on the amount of sleep reported each night during a week by a random sample of 20 high school students. Here are parallel boxplots comparing the distribution of time slept on all 7 nights of the study:
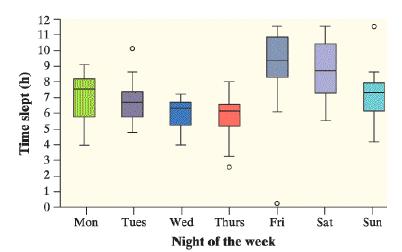
Use the graph to help answer the following questions.
a. Which distributions have a clear left-skewed shape?
b. Which outlier stands out the most, and why?
c. How does the typical amount of sleep that the students got compare on these seven nights?
d. On which night was there the most variation in how long the students slept? Justify your answer.
Fantastic news! We've Found the answer you've been seeking!
Step by Step Answer:
a From the parallel box plots graph observe that the distribution of the Monday ...View the full answer

Answered By
Ryan Beitler
My experience is teaching people over the phone with their computer related problems. I assist them in the best way that I can. I instruct them in detail on what to do to solve their computer issues. I am able to completely walkthrough a person about an entire process from A to Z.
0 Reviews
10+ Question Solved
Related Book For 

Question Posted:
