

The cumulative relative frequency graph shows the distribution of the percent of foreign-born residents in the 50
Question:
The cumulative relative frequency graph shows the distribution of the percent of foreign-born residents in the 50 states.
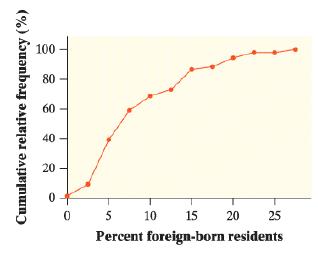
a. Estimate the interquartile range (IQR) of this distribution. Show your method.
b. What is the percentile for Arizona, which had 15.1% foreign-born residents that year?
c. Explain why the graph is fairly flat between 20% and 27.5%.
d. Draw the histogram that corresponds to this graph.
Fantastic news! We've Found the answer you've been seeking!
Step by Step Answer:
a Interquartile Range is one of the most effective measu...View the full answer

Answered By
Stephen Mwaura
I am a graduate with over 8 years freelance experience in writing, editing and proof-reading academic papers,SEO CONTENT and general articles. I am familiar with all major citation practices such as APA, MLA, Harvard and Chicago/Turabian. I have successfully completed, proofread and edited numerous SEO articles, term papers, essays, thesis and dissertations on different disciplines for hundreds of clients.
I am thorough in my research and I flawlessly adapt to any topic and style of writing. I am a firm believer in delivery beyond expectations and meeting the highest standards of work . As a perfectionist, I never compromise on quality, whatever the size of the task.
0 Reviews
10+ Question Solved
Related Book For 

Question Posted:
