

The dotplot shows the difference (Highway City) in EPA mileage ratings, in miles per gallon (mpg)
Question:
The dotplot shows the difference (Highway − City) in EPA mileage ratings, in miles per gallon (mpg) for each of 24 model year 2018 cars.
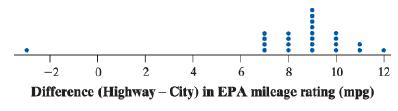
a. Explain what the dot above −3 represents.
b. What does the graph tell us about fuel economy in the city versus on the highway for these car models? Be specific.
Fantastic news! We've Found the answer you've been seeking!
Step by Step Answer:
Dot plot is a type of simple histogram like chart used i...View the full answer

Answered By
Richard Makau
I have been a statistics tutor for a while, basically
Helping students understand technical parts or problems from various topics such as test of hypothesis ,theory of estimation ,calculus ,statistics and probability .
My aim is to see students getting to understand the conceipts and being able to handle home works and exams on there own and being able to attain good grades.
I like tutoring and socializing with students , i always make sure i answer questions brought by students and make sure they also understand to be able to tackle any problem related .
0 Reviews
10+ Question Solved
Related Book For 

Question Posted:
