

The figure displays two density curves that model different distributions of quantitative data. Identify the location of
Question:
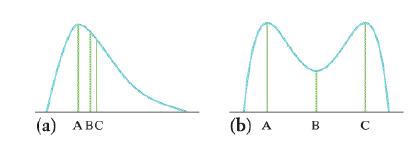
The figure displays two density curves that model different distributions of quantitative data. Identify the location of the mean and median by letter for each graph. Justify your answers.
Fantastic news! We've Found the answer you've been seeking!
Step by Step Answer:
Negative skew Figb b A huge chunk of data is towa...View the full answer

Answered By
Aswan S
Mechanical engineer
Subject matter expert of Mathematics , Physics and engineering solutions
0 Reviews
10+ Question Solved
Related Book For 

Question Posted:
