

The following bar graph shows the distribution of favorite subject for a sample of 1000 students. What
Question:
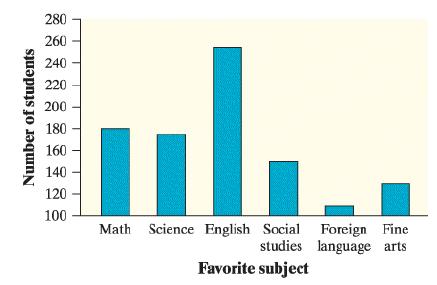
The following bar graph shows the distribution of favorite subject for a sample of 1000 students. What is the most serious problem with the graph?
a. The subjects are not listed in the correct order.
b. This distribution should be displayed with a pie chart.
c. The vertical axis should show the percent of students.
d. The vertical axis should start at 0 rather than 100.
e. The foreign language bar should be broken up by language.
Fantastic news! We've Found the answer you've been seeking!
Step by Step Answer:
Answer Option d The verical axis ...View the full answer

Answered By
Marvine Ekina
Marvine Ekina
Dedicated and experienced Academic Tutor with a proven track record for helping students to improve their academic performance. Adept at evaluating students and creating learning plans based on their strengths and weaknesses. Bringing forth a devotion to education and helping others to achieve their academic and life goals.
PERSONAL INFORMATION
Address: , ,
Nationality:
Driving License:
Hobbies: reading
SKILLS
????? Problem Solving Skills
????? Predictive Modeling
????? Customer Service Skills
????? Creative Problem Solving Skills
????? Strong Analytical Skills
????? Project Management Skills
????? Multitasking Skills
????? Leadership Skills
????? Curriculum Development
????? Excellent Communication Skills
????? SAT Prep
????? Knowledge of Educational Philosophies
????? Informal and Formal Assessments
0 Reviews
10+ Question Solved
Related Book For 

Question Posted:
