

The following Normal probability plot shows the distribution of points scored for the 551 players in a
Question:
The following Normal probability plot shows the distribution of points scored for the 551 players in a single NBA season.
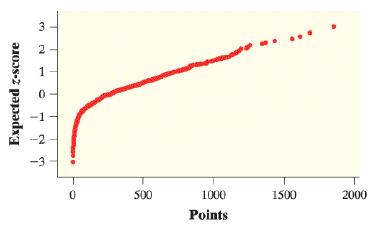
If the distribution of points was displayed in a histogram, what would be the best description of the histogram’s shape?
a. Approximately Normal
b. Symmetric but not approximately Normal
c. Skewed left
d. Skewed right
e. Cannot be determined
Select the best answer.
Fantastic news! We've Found the answer you've been seeking!
Step by Step Answer:
In the question the main idea is to determine the shape ...View the full answer

Answered By
Patrick Elizabeth
Patrick is a computer science graduate with diverse tutoring experience of more than 5 years in mathematics, Biology, Physics, data collection & entry, digital technology, programming, networking, web/software development, algorithms, instructional delivery, and computer repair & maintenance. He has an extensive knowledge of software development life cycle and proficiency in several programming languages. He’s dedicated to meeting customer requirements with innovative solutions that maximize efficiency and exceed capability targets.
0 Reviews
10+ Question Solved
Related Book For 

Question Posted:
