

The parallel dotplots show the total family income of randomly chosen individuals from Indiana (38 individuals) and
Question:
The parallel dotplots show the total family income of randomly chosen individuals from Indiana (38 individuals) and New Jersey (44 individuals). Means and standard deviations are given below the dotplots.
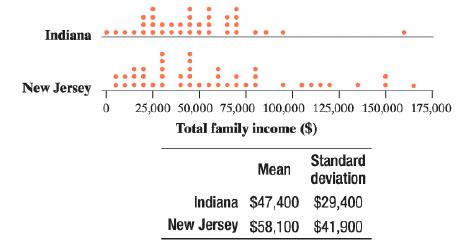
Consider individuals in each state with total family incomes of $95,000. Which individual has a higher income, relative to others in his or her state? Use percentiles and z-scores to support your answer.
Fantastic news! We've Found the answer you've been seeking!
Step by Step Answer:
Answer A sample of the data for the for the total income are as follow...View the full answer

Answered By
Hamza Amjad
Currently I am student in master degree program.from last two year I am tutring in Academy and I tought many O/A level student in home tution.
3+ Reviews
10+ Question Solved
Related Book For 

Question Posted:
