

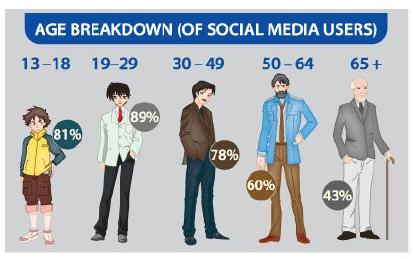
The Pew Research Center surveyed a random sample of U.S. teens and adults about their use of
Question:
The Pew Research Center surveyed a random sample of U.S. teens and adults about their use of social media. The following pictograph displays some results. Explain how this graph is misleading.
Fantastic news! We've Found the answer you've been seeking!
Step by Step Answer:
Based on the heights of the people ...View the full answer

Answered By
Robert Omolo
I am a proficient academic writer who is experienced in delivering quality work. Robert is a fast typist, skilled in both Microsoft word, excel and Power Point and thus would deliver easily and faster on the assignments based on such products. I deliver plagiarism free work with no grammatical errors and are well researched from reliable sources. I am well conversant with the writing styles such as APA, MLA, Harvard, Chicago and many more. Besides, I deliver assigned task on time. To ensure that I am always effective to the company and the client, I am available 24-7 therefore able to take urgent orders and receive late night calls. Thankyou
0 Reviews
10+ Question Solved
Related Book For 

Question Posted:
