

Which of the following boxplots best matches the distribution shown in the histogram? 4 10 12 Data
Question:
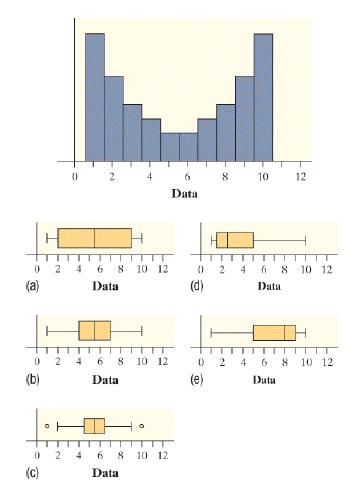
Which of the following boxplots best matches the distribution shown in the histogram?
Fantastic news! We've Found the answer you've been seeking!
Step by Step Answer:
Option A is correct The first box plot best matches the distrib...View the full answer

Answered By
Richard Makau
I have been a statistics tutor for a while, basically
Helping students understand technical parts or problems from various topics such as test of hypothesis ,theory of estimation ,calculus ,statistics and probability .
My aim is to see students getting to understand the conceipts and being able to handle home works and exams on there own and being able to attain good grades.
I like tutoring and socializing with students , i always make sure i answer questions brought by students and make sure they also understand to be able to tackle any problem related .
0 Reviews
10+ Question Solved
Related Book For 

Question Posted:
