

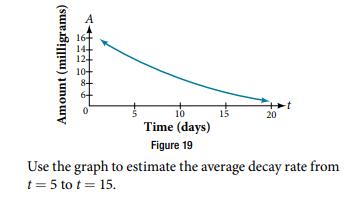
He graph in Figure 19 illustrates the decay of a radioactive substance over t days. Amount (milligrams)
Question:
He graph in Figure 19 illustrates the decay of a radioactive substance over t days.
Fantastic news! We've Found the answer you've been seeking!
Step by Step Answer:
t5 to t15 for ...View the full answer

Answered By
Hardik Dudhat
I am semi-qualified Chemical Engineering ,I have scored centum in accounting in my senior secondary and in my graduation. I have always helped my fellow students with their concerns on the subject, i have tutored on various tutoring sites in the past and also have taken home tuitions for degree and MBA students. As a tutor, I don't want my students to just get a solution, I want them to understand the concept and never have a doubt in that area thereon and i believe in excelling and not in educating.
0 Reviews
10+ Question Solved
Related Book For 
Question Posted:
