

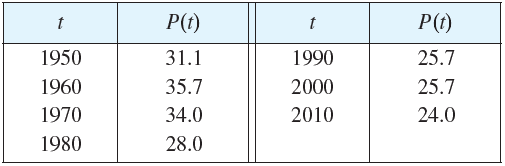
Let P(t) be the percentage of Americans under the age of 18 at time t. The table
Question:
Let P(t) be the percentage of Americans under the age of 18 at time t. The table gives values of this function in census years from 1950 to 2010.
(a) What is the meaning of P'(t)? What are its units?
(b) Construct a table of estimated values for P'(t).
(c) Graph P and P'.
(d) How would it be possible to get more accurate values for P'(t)?
Fantastic news! We've Found the answer you've been seeking!
Step by Step Answer:
a P t is the rate at which the percentage of Americans under the age of 18 is changing with res...View the full answer

Answered By
Patrick Busaka
I am a result oriented and motivated person with passion for challenges because they provide me an opportunity to grow professionally.
38+ Reviews
58+ Question Solved
Related Book For 

Question Posted:
