

Shown is a contour map of atmospheric pressure in North America on August 12, 2008. On the
Question:
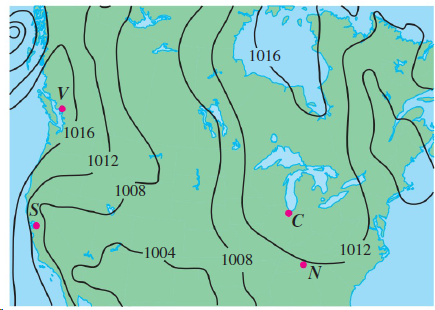
Shown is a contour map of atmospheric pressure in North America on August 12, 2008. On the level curves (called isobars) the pressure is indicated in millibars (mb).
(a) Estimate the pressure at C (Chicago), N (Nashville), S (San Francisco), and V (Vancouver).
(b) At which of these locations were the winds strongest?
Fantastic news! We've Found the answer you've been seeking!
Step by Step Answer:
a C Chicago lies between level curves with pressures 1012 and 1016 mb and since C appears to be loca...View the full answer

Answered By
Collins Omondi
I have been an academic and content writer for at least 6 years, working on different academic fields including accounting, political science, technology, law, and nursing in addition to those earlier listed under my education background.
I have a Bachelor’s degree in Commerce (Accounting option), and vast knowledge in various academic fields Finance, Economics, Marketing, Management, Social Science, Women and Gender, Business law, and Statistics among others.
4+ Reviews
16+ Question Solved
Related Book For 

Question Posted:
