

The table shows the number of people per day who died from SARS in Singapore at two-week
Question:
The table shows the number of people per day who died from SARS in Singapore at two-week intervals beginning on March 1, 2003.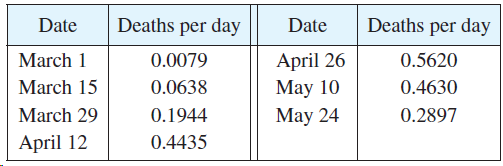 (a) By using an argument similar to that in Example 4, estimate the number of people who died of SARS in Singapore between March 1 and May 24, 2003, using both left endpoints and right endpoints.
(b) How would you interpret the number of SARS deaths as an area under a curve?
Fantastic news! We've Found the answer you've been seeking!
Step by Step Answer:
a Use t 14 days The number of people who died of SAR...View the full answer

Answered By
PRINCE PANDEY
I am Indian Chartered Accounting having a strong hold in the subjects of Accounting, IFRS Reporting, Indian
Taxation, Cost Accounting, Auditing. I have vast experience of teaching a student with easy way problem-solving approach.
1+ Reviews
10+ Question Solved
Related Book For 

Question Posted:
