

Refer to the Fourier transform infrared spectrum in Figure 19-32. (a) The interferogram was sampled at retardation
Question:
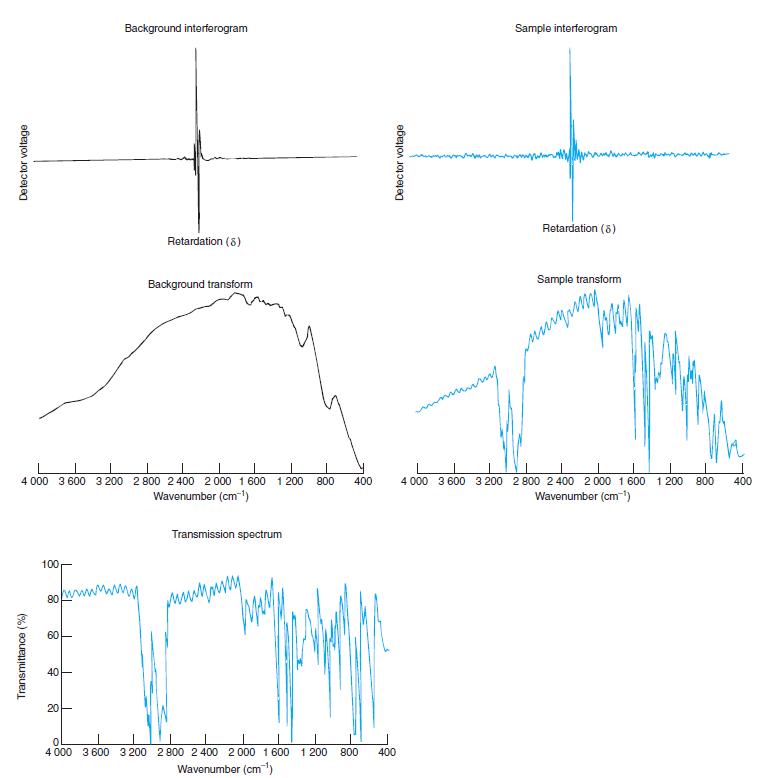
Refer to the Fourier transform infrared spectrum in Figure 19-32.
(a) The interferogram was sampled at retardation intervals of 1.2660 × 10⁻⁴ cm. What is the theoretical wavenumber range (0 to ?) of the spectrum?
(b) A total of 4 096 data points were collected from δ = -Δ to δ = +Δ. Compute the value of Δ, the maximum retardation.
(c) Calculate the approximate resolution of the spectrum.
(d) The interferometer mirror velocity is given in the figure caption. How many microseconds elapse between each datum?
(e) How many seconds were required to record each interferogram once?
(f) What kind of beamsplitter is typically used for the region 400 to 4 000 cm-1? Why is the region below 400 cm-1 not observed?
Figure 19-32
Fantastic news! We've Found the answer you've been seeking!
Step by Step Answer:
a The wavenumber range is given by the formula sql Copy code range 1 2 retardation interval Substitu...View the full answer

Answered By
BillClinton Muguai
I have been a tutor for the past 5 years. I have experience working with students in a variety of subject areas, including computer science, math, science, English, and history. I have also worked with students of all ages, from elementary school to college. In addition to my tutoring experience, I have a degree in education from a top university. This has given me a strong foundation in child development and learning theories, which I use to inform my tutoring practices.
I am patient and adaptable, and I work to create a positive and supportive learning environment for my students. I believe that all students have the ability to succeed, and it is my job to help them find and develop their strengths. I am confident in my ability to tutor students and help them achieve their academic goals.
0 Reviews
10+ Question Solved
Related Book For 

Question Posted:
