

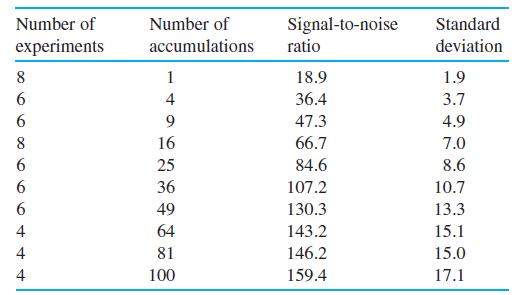
The table shows signal-to-noise ratios recorded in a nuclear magnetic resonance experiment. Construct graphs of (a) signal-tonoise
Question:
The table shows signal-to-noise ratios recorded in a nuclear magnetic resonance experiment. Construct graphs of (a) signal-tonoise ratio versus n and (b) signal-to-noise ratio versus √n, where n is the number of scans. Draw error bars corresponding to the standard deviation at each point. Is the signal-to-noise ratio proportional to √n? Find the 95% confidence interval for each row of the table.
Signal-to-noise ratio at the aromatic protons of 1% ethylbenzene in CCl4
Fantastic news! We've Found the answer you've been seeking!
Step by Step Answer:
To construct the graphs of signaltonoise ratio versus n and signaltonoise ratio versus n a Signalton...View the full answer

Answered By
Faith Waigi
As a tutor applicant, I possess a strong educational background and relevant experience that make me well-suited for the role. I have a solid foundation in [mention your academic qualifications or degrees] from [name of educational institution]. My education has equipped me with in-depth knowledge and expertise in various subjects, allowing me to effectively teach and guide students.
In terms of tutoring experience, I have had the privilege of working with students from diverse backgrounds and age groups. I have worked as a tutor for [mention duration or number of years] where I provided one-on-one instruction and support to students. During this time, I developed the ability to tailor my teaching methods to meet the unique learning styles and needs of each student.
0 Reviews
10+ Question Solved
Related Book For 

Question Posted:
