

1. The following data includes per capita income for several countries. Find (a) the mean, (b) the...
Fantastic news! We've Found the answer you've been seeking!
Question:
1. The following data includes per capita income for several countries. Find (a) the mean, (b) the median, (c) the mode, (d) the midrange, (e) the variance, (f) the standard deviation, (g) the five number summary and (g) create a boxplot of the data
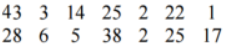
2- Using the data set from problem 1, compute the z-scores for each of the following
a) 43
(b) 17
(c) 1
3- For each situation, state which measure of central tendency ? mean, median, or mode ? should be used.
(a) The data are categorical
(b) We want to sort the data into its top half and bottom half
(c) One also wants to compute the variance and standard deviation
Expert Answer:

Related Book For 

Elementary Statistics A step by step approach
ISBN: 978-0073386102
8th edition
Authors: Allan Bluman
Posted Date:
