

Figure below shows the plot of Fault distance vs voltage sag magnitude with and without a local
Fantastic news! We've Found the answer you've been seeking!
Question:
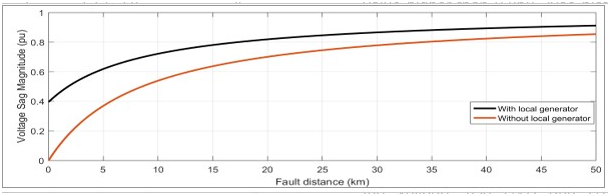
Figure below shows the plot of Fault distance vs voltage sag magnitude with and without a local generator.
Explain the reason for
a) Variation in voltage magnitude with respect to the fault location and
b) Difference in voltage magnitude for a system with a local generator and without a local generator.
Expert Answer:
a Variation of voltage magnitude with respect to fault location will be low due fault oc... View the full answer

Related Book For 

Introduction to Statistical Investigations
ISBN: 978-1118922002
1st edition
Authors: Beth L.Chance, George W.Cobb, Allan J.Rossman Nathan Tintle, Todd Swanson Soma Roy
Posted Date:
