

Small boxes of NutraFlakes cereal are labeled ?net weight 10 ounces.? Each hour, random samples of size
Question:
Small boxes of NutraFlakes cereal are labeled ?net weight 10 ounces.? Each hour, random samples of size n = 4 boxes are weighed to check process control. Five hours of observations yielded the following:
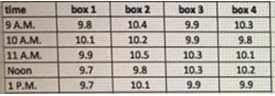
a. Using these data and the information in the Control Chart Limits Factors Table below (if you are doing it by hand), construct limits for xbar- and R-charts.
b. Is the process in control?
c. What other steps should the QC department follow at this point?
Control Chart Limits Factors Sample Size Mean Factor A2 Upper Range D4 Lower RangeD3 2 1.880 3.628 0 3 1.023 2.574 0 4 0.729 2.282 0 5 0.577 2.114 0 6 0.483 2.004 0 7 0.419 1.924 0.076 8 0.373 1.864 0.136 9 0.337 1.816 0.184 10 0.308 1.777 0.223 12 0.266 1.716 0.284
Expert Answer:
a Using these data construct limits for x and R charts We note that x 1004 and ... View the full answer


Quantitative Analysis for Management
ISBN: 978-0132149112
11th Edition
Authors: Barry render, Ralph m. stair, Michael e. Hanna
