

1. Sketch a graph to predict the concentration of substrate in a reaction over time with time...
Fantastic news! We've Found the answer you've been seeking!
Question:
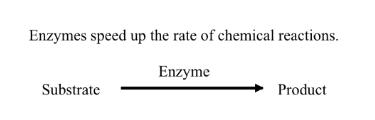
1. Sketch a graph to predict the concentration of substrate in a reaction over time with time on the x-axis and amount of substrate on the y-axis.
2. Sketch a graph to predict the concentration of product over time with time on the x-axis and amount of product on the y-axis.
3. Given the two graphs , how would the rate at which the enzyme converts substrate into product be determined? (Hint: think about the concentration of reactants in a period of time, like 'miles per hour')
Expert Answer:

Related Book For 

Discovering Advanced Algebra An Investigative Approach
ISBN: 978-1559539845
1st edition
Authors: Jerald Murdock, Ellen Kamischke, Eric Kamischke
Posted Date:
