

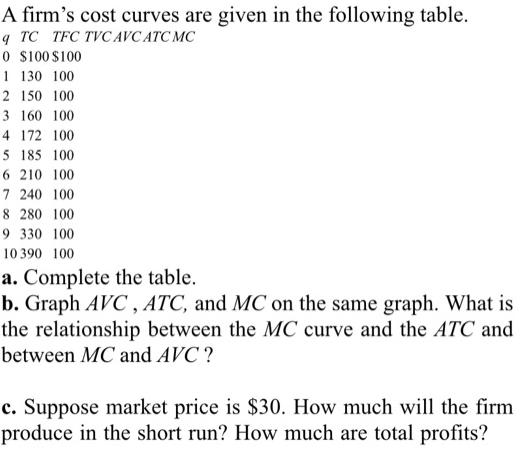
A firm's cost curves are given in the following table. 9 TC TFC TVC AVC ATC...
Fantastic news! We've Found the answer you've been seeking!
Question:
Expert Answer:

Related Book For 

An Introduction To Statistical Methods And Data Analysis
ISBN: 9781305465527
7th Edition
Authors: R. Lyman Ott, Micheal T. Longnecker
Posted Date:
