

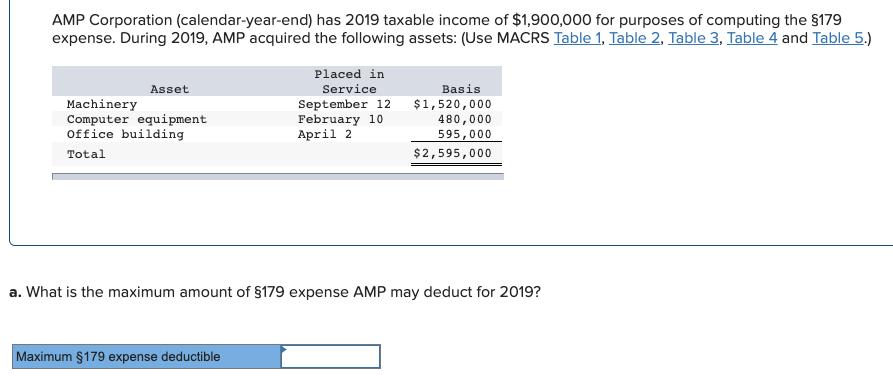
AMP Corporation (calendar-year-end) has 2019 taxable income of $1,900,000 for purposes of computing the $179 expense....
Fantastic news! We've Found the answer you've been seeking!
Question:
Transcribed Image Text:
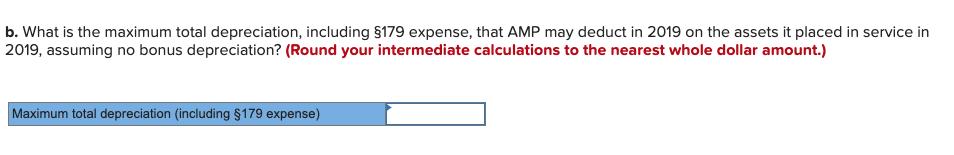
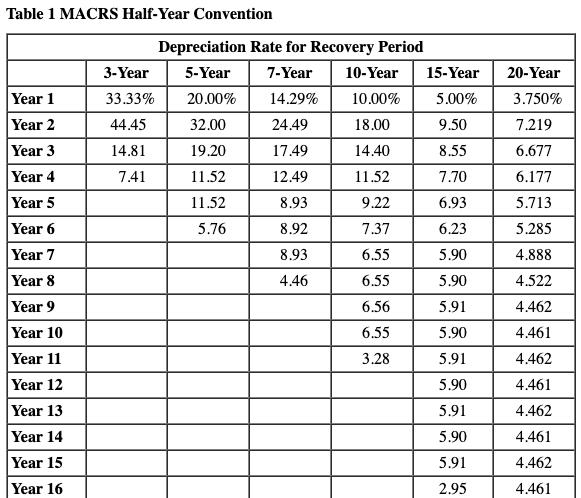
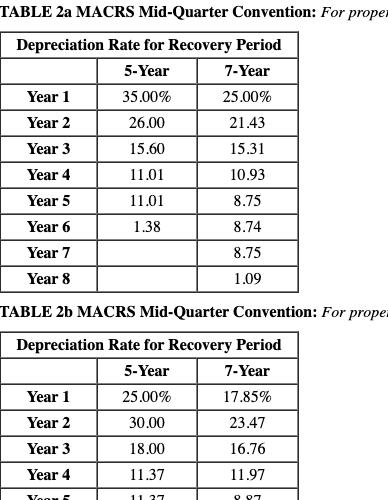
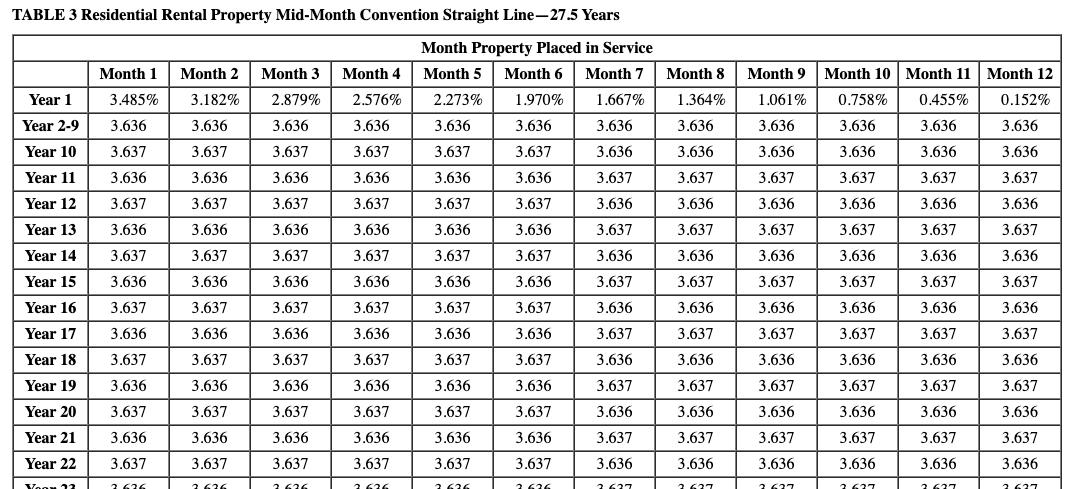
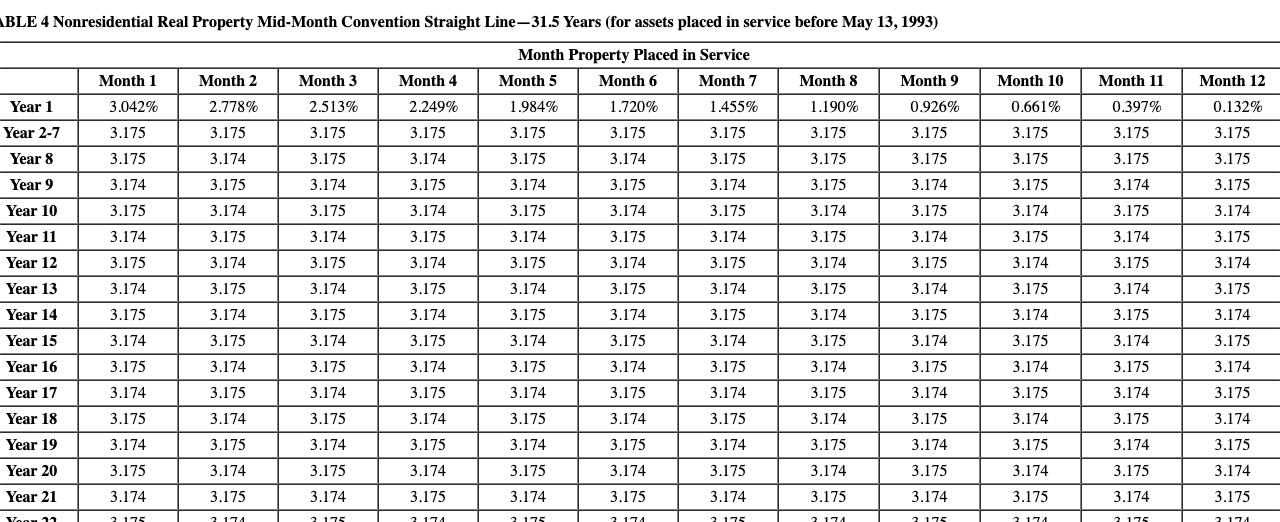
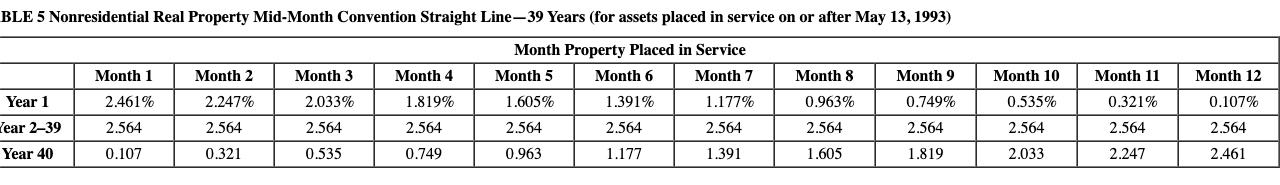
AMP Corporation (calendar-year-end) has 2019 taxable income of $1,900,000 for purposes of computing the $179 expense. During 2019, AMP acquired the following assets: (Use MACRS Table 1, Table 2, Table 3, Table 4 and Table 5.) Placed in Asset Service Basis Machinery Computer equipment Office building September 12 February 10 April 2 $1,520,000 480,000 595,000 Total $2,595,000 a. What is the maximum amount of $179 expense AMP may deduct for 2019? Maximum $179 expense deductible b. What is the maximum total depreciation, including $179 expense, that AMP may deduct in 2019 on the assets it placed in service in 2019, assuming no bonus depreciation? (Round your intermediate calculations to the nearest whole dollar amount.) Maximum total depreciation (including $179 expense) Table 1 MACRS Half-Year Convention Depreciation Rate for Recovery Period 3-Year 5-Year 7-Year 10-Year 15-Year 20-Year Year 1 Year 2 33.33% 20.00% 14.29% 10.00% 5.00% 3.750% 44.45 32.00 24.49 18.00 9.50 7.219 Year 3 14.81 19.20 17.49 14.40 8.55 6.677 Year 4 7.41 11.52 12.49 11.52 7.70 6.177 Year 5 11.52 8.93 9.22 6.93 5.713 Year 6 Year 7 Year 8 5.76 8.92 7.37 6.23 5.285 8.93 6.55 5.90 4.888 4.46 6.55 5.90 4.522 Year 9 6.56 5.91 4.462 Year 10 Year 11 Year 12 6.55 5.90 4.461 3.28 5.91 4.462 5.90 4.461 Year 13 5.91 4.462 Year 14 5.90 4.461 Year 15 5.91 4.462 Year 16 2.95 4.461 TABLE 2a MACRS Mid-Quarter Convention: For proper Depreciation Rate for Recovery Period 5-Year 7-Year Year 1 35.00% 25.00% Year 2 26.00 21.43 Year 3 15.60 15.31 Year 4 11.01 10.93 Year 5 11.01 8.75 Year 6 1.38 8.74 Year 7 8.75 Year 8 1.09 TABLE 2b MACRS Mid-Quarter Convention: For prope Depreciation Rate for Recovery Period 5-Year 7-Year Year 1 25.00% 17.85% Year 2 30.00 23.47 Year 3 18.00 16.76 Year 4 11.37 11.97 Voom 11. 27 O 07 TABLE 3 Residential Rental Property Mid-Month Convention Straight Line-27.5 Years Month Property Placed in Service Month 1 Month 2 Month 3 Month 4 Month 5 Month 6 Month 7 Month 8 Month 9 Month 10 Month 11 Month 12 Year 1 3.485% 3.182% 2.879% 2.576% 2.273% 1.970% 1.667% 1.364% 1.061% 0.758% 0.455% 0.152% Year 2-9 3.636 3.636 3.636 3.636 3.636 3.636 3.636 3.636 3.636 3.636 3.636 3.636 Year 10 3.637 3.637 3.637 3.637 3.637 3.637 3.636 3.636 3.636 3.636 3.636 3.636 Year 11 3.636 3.636 3.636 3.636 3.636 3.636 3.637 3.637 3.637 3.637 3.637 3.637 Year 12 3.637 3.637 3.637 3.637 3.637 3.637 3.636 3.636 3.636 3.636 3.636 3.636 Year 13 3.636 3.636 3.636 3.636 3.636 3.636 3.637 3.637 3.637 3.637 3.637 3.637 Year 14 3.637 3.637 3.637 3.637 3.637 3.637 3.636 3.636 3.636 3.636 3.636 3.636 Year 15 3.636 3.636 3.636 3.636 3.636 3.636 3.637 3.637 3.637 3.637 3.637 3.637 Year 16 3.637 3.637 3.637 3.637 3.637 3.637 3.636 3.636 3.636 3.636 3.636 3.636 Year 17 3.636 3.636 3.636 3.636 3.636 3.636 3.637 3.637 3.637 3.637 3.637 3.637 Year 18 3.637 3.637 3.637 3.637 3.637 3.637 3.636 3.636 3.636 3.636 3.636 3.636 Year 19 3.636 3.636 3.636 3.636 3.636 3,636 3.637 3.637 3.637 3.637 3.637 3.637 Year 20 3.637 3.637 3.637 3.637 3.637 3.637 3.636 3.636 3.636 3.636 3.636 3.636 Year 21 3.636 3.636 3.636 3.636 3.636 3.636 3.637 3.637 3.637 3.637 3.637 3.637 Year 22 3.637 3.637 3.637 3.637 3.637 3.637 3.636 3.636 3.636 3.636 3.636 3.636 Yoon 13 3 636 1 636 3 636 3 636 3 636 1 636 3 627 1 67 3 627 3 637 3 637 3637 ABLE 4 Nonresidential Real Property Mid-Month Convention Straight Line-31.5 Years (for assets placed in service before May 13, 1993) Month Property Placed in Service Month 1 Month 2 Month 3 Month 4 Month 5 Month 6 Month 7 Month 8 Month 9 Month 10 Month 11 Month 12 Year 1 3.042% 2.778% 2.513% 2.249% 1.984% 1.720% 1.455% 1.190% 0.926% 0.661% 0.397% 0.132% Year 2-7 3.175 3.175 3.175 3.175 3.175 3.175 3.175 3.175 3.175 3.175 3.175 3.175 Year 8 3.175 3.174 3.175 3.174 3.175 3.174 3.175 3.175 3.175 3.175 3.175 3.175 Year 9 3.174 3.175 3.174 3.175 3.174 3.175 3,174 3.175 3.174 3.175 3.174 3.175 Year 10 3.175 3.174 3.175 3.174 3.175 3.174 3.175 3.174 3.175 3.174 3.175 3.174 Year 11 3.174 3.175 3.174 3.175 3.174 3.175 3.174 3.175 3.174 3.175 3.174 3.175 Year 12 3.175 3.174 3.175 3.174 3.175 3.174 3.175 3.174 3.175 3.174 3.175 3.174 Year 13 3.174 3.175 3.174 3.175 3.174 3.175 3.174 3.175 3.174 3.175 3.174 3.175 Year 14 3.175 3.174 3.175 3.174 3.175 3.174 3.175 3.174 3.175 3.174 3.175 3.174 Year 15 3.174 3.175 3.174 3.175 3.174 3.175 3.174 3.175 3.174 3.175 3.174 3.175 Year 16 3.175 3.174 3.175 3.174 3.175 3.174 3.175 3.174 3.175 3.174 3.175 3.174 Year 17 3.174 3.175 3.174 3.175 3.174 3,175 3.174 3.175 3.174 3.175 3.174 3.175 Year 18 3.175 3.174 3.175 3.174 3.175 3.174 3.175 3.174 3.175 3.174 3.175 3.174 Year 19 3.174 3.175 3.174 3.175 3.174 3.175 3.174 3.175 3.174 3.175 3.174 3.175 Year 20 3.175 3.174 3.175 3.174 3.175 3.174 3.175 3.174 3.175 3.174 3.175 3.174 Year 21 3.174 3.175 3.174 3.175 3.174 3.175 3.174 3.175 3.174 3.175 3.174 3.175 Yoou 11 2 175 2 174 1 175 1 174 3 174 1 175 3 174 7 175 2 174 2 175 2 174 2175 BLE 5 Nonresidential Real Property Mid-Month Convention Straight Line-39 Years (for assets placed in service on or after May 13, 1993) Month Property Placed in Service Month 1 Month 2 Month 3 Month 4 Month 5 Month 6 Month 7 Month 8 Month 9 Month 10 Month 11 Month 12 Year 1 2.461% 2.247% 2.033% 1.819% 1.605% 1.391% 1.177% 0.963% 0.749% 0,535% 0.321% 0.107% Tear 2-39 2.564 2.564 2.564 2.564 2.564 2.564 2.564 2.564 2.564 2.564 2.564 2.564 Year 40 0.107 0.321 0.535 0.749 0.963 1.177 1.391 1.605 1.819 2.033 2.247 2.461 AMP Corporation (calendar-year-end) has 2019 taxable income of $1,900,000 for purposes of computing the $179 expense. During 2019, AMP acquired the following assets: (Use MACRS Table 1, Table 2, Table 3, Table 4 and Table 5.) Placed in Asset Service Basis Machinery Computer equipment Office building September 12 February 10 April 2 $1,520,000 480,000 595,000 Total $2,595,000 a. What is the maximum amount of $179 expense AMP may deduct for 2019? Maximum $179 expense deductible b. What is the maximum total depreciation, including $179 expense, that AMP may deduct in 2019 on the assets it placed in service in 2019, assuming no bonus depreciation? (Round your intermediate calculations to the nearest whole dollar amount.) Maximum total depreciation (including $179 expense) Table 1 MACRS Half-Year Convention Depreciation Rate for Recovery Period 3-Year 5-Year 7-Year 10-Year 15-Year 20-Year Year 1 Year 2 33.33% 20.00% 14.29% 10.00% 5.00% 3.750% 44.45 32.00 24.49 18.00 9.50 7.219 Year 3 14.81 19.20 17.49 14.40 8.55 6.677 Year 4 7.41 11.52 12.49 11.52 7.70 6.177 Year 5 11.52 8.93 9.22 6.93 5.713 Year 6 Year 7 Year 8 5.76 8.92 7.37 6.23 5.285 8.93 6.55 5.90 4.888 4.46 6.55 5.90 4.522 Year 9 6.56 5.91 4.462 Year 10 Year 11 Year 12 6.55 5.90 4.461 3.28 5.91 4.462 5.90 4.461 Year 13 5.91 4.462 Year 14 5.90 4.461 Year 15 5.91 4.462 Year 16 2.95 4.461 TABLE 2a MACRS Mid-Quarter Convention: For proper Depreciation Rate for Recovery Period 5-Year 7-Year Year 1 35.00% 25.00% Year 2 26.00 21.43 Year 3 15.60 15.31 Year 4 11.01 10.93 Year 5 11.01 8.75 Year 6 1.38 8.74 Year 7 8.75 Year 8 1.09 TABLE 2b MACRS Mid-Quarter Convention: For prope Depreciation Rate for Recovery Period 5-Year 7-Year Year 1 25.00% 17.85% Year 2 30.00 23.47 Year 3 18.00 16.76 Year 4 11.37 11.97 Voom 11. 27 O 07 TABLE 3 Residential Rental Property Mid-Month Convention Straight Line-27.5 Years Month Property Placed in Service Month 1 Month 2 Month 3 Month 4 Month 5 Month 6 Month 7 Month 8 Month 9 Month 10 Month 11 Month 12 Year 1 3.485% 3.182% 2.879% 2.576% 2.273% 1.970% 1.667% 1.364% 1.061% 0.758% 0.455% 0.152% Year 2-9 3.636 3.636 3.636 3.636 3.636 3.636 3.636 3.636 3.636 3.636 3.636 3.636 Year 10 3.637 3.637 3.637 3.637 3.637 3.637 3.636 3.636 3.636 3.636 3.636 3.636 Year 11 3.636 3.636 3.636 3.636 3.636 3.636 3.637 3.637 3.637 3.637 3.637 3.637 Year 12 3.637 3.637 3.637 3.637 3.637 3.637 3.636 3.636 3.636 3.636 3.636 3.636 Year 13 3.636 3.636 3.636 3.636 3.636 3.636 3.637 3.637 3.637 3.637 3.637 3.637 Year 14 3.637 3.637 3.637 3.637 3.637 3.637 3.636 3.636 3.636 3.636 3.636 3.636 Year 15 3.636 3.636 3.636 3.636 3.636 3.636 3.637 3.637 3.637 3.637 3.637 3.637 Year 16 3.637 3.637 3.637 3.637 3.637 3.637 3.636 3.636 3.636 3.636 3.636 3.636 Year 17 3.636 3.636 3.636 3.636 3.636 3.636 3.637 3.637 3.637 3.637 3.637 3.637 Year 18 3.637 3.637 3.637 3.637 3.637 3.637 3.636 3.636 3.636 3.636 3.636 3.636 Year 19 3.636 3.636 3.636 3.636 3.636 3,636 3.637 3.637 3.637 3.637 3.637 3.637 Year 20 3.637 3.637 3.637 3.637 3.637 3.637 3.636 3.636 3.636 3.636 3.636 3.636 Year 21 3.636 3.636 3.636 3.636 3.636 3.636 3.637 3.637 3.637 3.637 3.637 3.637 Year 22 3.637 3.637 3.637 3.637 3.637 3.637 3.636 3.636 3.636 3.636 3.636 3.636 Yoon 13 3 636 1 636 3 636 3 636 3 636 1 636 3 627 1 67 3 627 3 637 3 637 3637 ABLE 4 Nonresidential Real Property Mid-Month Convention Straight Line-31.5 Years (for assets placed in service before May 13, 1993) Month Property Placed in Service Month 1 Month 2 Month 3 Month 4 Month 5 Month 6 Month 7 Month 8 Month 9 Month 10 Month 11 Month 12 Year 1 3.042% 2.778% 2.513% 2.249% 1.984% 1.720% 1.455% 1.190% 0.926% 0.661% 0.397% 0.132% Year 2-7 3.175 3.175 3.175 3.175 3.175 3.175 3.175 3.175 3.175 3.175 3.175 3.175 Year 8 3.175 3.174 3.175 3.174 3.175 3.174 3.175 3.175 3.175 3.175 3.175 3.175 Year 9 3.174 3.175 3.174 3.175 3.174 3.175 3,174 3.175 3.174 3.175 3.174 3.175 Year 10 3.175 3.174 3.175 3.174 3.175 3.174 3.175 3.174 3.175 3.174 3.175 3.174 Year 11 3.174 3.175 3.174 3.175 3.174 3.175 3.174 3.175 3.174 3.175 3.174 3.175 Year 12 3.175 3.174 3.175 3.174 3.175 3.174 3.175 3.174 3.175 3.174 3.175 3.174 Year 13 3.174 3.175 3.174 3.175 3.174 3.175 3.174 3.175 3.174 3.175 3.174 3.175 Year 14 3.175 3.174 3.175 3.174 3.175 3.174 3.175 3.174 3.175 3.174 3.175 3.174 Year 15 3.174 3.175 3.174 3.175 3.174 3.175 3.174 3.175 3.174 3.175 3.174 3.175 Year 16 3.175 3.174 3.175 3.174 3.175 3.174 3.175 3.174 3.175 3.174 3.175 3.174 Year 17 3.174 3.175 3.174 3.175 3.174 3,175 3.174 3.175 3.174 3.175 3.174 3.175 Year 18 3.175 3.174 3.175 3.174 3.175 3.174 3.175 3.174 3.175 3.174 3.175 3.174 Year 19 3.174 3.175 3.174 3.175 3.174 3.175 3.174 3.175 3.174 3.175 3.174 3.175 Year 20 3.175 3.174 3.175 3.174 3.175 3.174 3.175 3.174 3.175 3.174 3.175 3.174 Year 21 3.174 3.175 3.174 3.175 3.174 3.175 3.174 3.175 3.174 3.175 3.174 3.175 Yoou 11 2 175 2 174 1 175 1 174 3 174 1 175 3 174 7 175 2 174 2 175 2 174 2175 BLE 5 Nonresidential Real Property Mid-Month Convention Straight Line-39 Years (for assets placed in service on or after May 13, 1993) Month Property Placed in Service Month 1 Month 2 Month 3 Month 4 Month 5 Month 6 Month 7 Month 8 Month 9 Month 10 Month 11 Month 12 Year 1 2.461% 2.247% 2.033% 1.819% 1.605% 1.391% 1.177% 0.963% 0.749% 0,535% 0.321% 0.107% Tear 2-39 2.564 2.564 2.564 2.564 2.564 2.564 2.564 2.564 2.564 2.564 2.564 2.564 Year 40 0.107 0.321 0.535 0.749 0.963 1.177 1.391 1.605 1.819 2.033 2.247 2.461 AMP Corporation (calendar-year-end) has 2019 taxable income of $1,900,000 for purposes of computing the $179 expense. During 2019, AMP acquired the following assets: (Use MACRS Table 1, Table 2, Table 3, Table 4 and Table 5.) Placed in Asset Service Basis Machinery Computer equipment Office building September 12 February 10 April 2 $1,520,000 480,000 595,000 Total $2,595,000 a. What is the maximum amount of $179 expense AMP may deduct for 2019? Maximum $179 expense deductible b. What is the maximum total depreciation, including $179 expense, that AMP may deduct in 2019 on the assets it placed in service in 2019, assuming no bonus depreciation? (Round your intermediate calculations to the nearest whole dollar amount.) Maximum total depreciation (including $179 expense) Table 1 MACRS Half-Year Convention Depreciation Rate for Recovery Period 3-Year 5-Year 7-Year 10-Year 15-Year 20-Year Year 1 Year 2 33.33% 20.00% 14.29% 10.00% 5.00% 3.750% 44.45 32.00 24.49 18.00 9.50 7.219 Year 3 14.81 19.20 17.49 14.40 8.55 6.677 Year 4 7.41 11.52 12.49 11.52 7.70 6.177 Year 5 11.52 8.93 9.22 6.93 5.713 Year 6 Year 7 Year 8 5.76 8.92 7.37 6.23 5.285 8.93 6.55 5.90 4.888 4.46 6.55 5.90 4.522 Year 9 6.56 5.91 4.462 Year 10 Year 11 Year 12 6.55 5.90 4.461 3.28 5.91 4.462 5.90 4.461 Year 13 5.91 4.462 Year 14 5.90 4.461 Year 15 5.91 4.462 Year 16 2.95 4.461 TABLE 2a MACRS Mid-Quarter Convention: For proper Depreciation Rate for Recovery Period 5-Year 7-Year Year 1 35.00% 25.00% Year 2 26.00 21.43 Year 3 15.60 15.31 Year 4 11.01 10.93 Year 5 11.01 8.75 Year 6 1.38 8.74 Year 7 8.75 Year 8 1.09 TABLE 2b MACRS Mid-Quarter Convention: For prope Depreciation Rate for Recovery Period 5-Year 7-Year Year 1 25.00% 17.85% Year 2 30.00 23.47 Year 3 18.00 16.76 Year 4 11.37 11.97 Voom 11. 27 O 07 TABLE 3 Residential Rental Property Mid-Month Convention Straight Line-27.5 Years Month Property Placed in Service Month 1 Month 2 Month 3 Month 4 Month 5 Month 6 Month 7 Month 8 Month 9 Month 10 Month 11 Month 12 Year 1 3.485% 3.182% 2.879% 2.576% 2.273% 1.970% 1.667% 1.364% 1.061% 0.758% 0.455% 0.152% Year 2-9 3.636 3.636 3.636 3.636 3.636 3.636 3.636 3.636 3.636 3.636 3.636 3.636 Year 10 3.637 3.637 3.637 3.637 3.637 3.637 3.636 3.636 3.636 3.636 3.636 3.636 Year 11 3.636 3.636 3.636 3.636 3.636 3.636 3.637 3.637 3.637 3.637 3.637 3.637 Year 12 3.637 3.637 3.637 3.637 3.637 3.637 3.636 3.636 3.636 3.636 3.636 3.636 Year 13 3.636 3.636 3.636 3.636 3.636 3.636 3.637 3.637 3.637 3.637 3.637 3.637 Year 14 3.637 3.637 3.637 3.637 3.637 3.637 3.636 3.636 3.636 3.636 3.636 3.636 Year 15 3.636 3.636 3.636 3.636 3.636 3.636 3.637 3.637 3.637 3.637 3.637 3.637 Year 16 3.637 3.637 3.637 3.637 3.637 3.637 3.636 3.636 3.636 3.636 3.636 3.636 Year 17 3.636 3.636 3.636 3.636 3.636 3.636 3.637 3.637 3.637 3.637 3.637 3.637 Year 18 3.637 3.637 3.637 3.637 3.637 3.637 3.636 3.636 3.636 3.636 3.636 3.636 Year 19 3.636 3.636 3.636 3.636 3.636 3,636 3.637 3.637 3.637 3.637 3.637 3.637 Year 20 3.637 3.637 3.637 3.637 3.637 3.637 3.636 3.636 3.636 3.636 3.636 3.636 Year 21 3.636 3.636 3.636 3.636 3.636 3.636 3.637 3.637 3.637 3.637 3.637 3.637 Year 22 3.637 3.637 3.637 3.637 3.637 3.637 3.636 3.636 3.636 3.636 3.636 3.636 Yoon 13 3 636 1 636 3 636 3 636 3 636 1 636 3 627 1 67 3 627 3 637 3 637 3637 ABLE 4 Nonresidential Real Property Mid-Month Convention Straight Line-31.5 Years (for assets placed in service before May 13, 1993) Month Property Placed in Service Month 1 Month 2 Month 3 Month 4 Month 5 Month 6 Month 7 Month 8 Month 9 Month 10 Month 11 Month 12 Year 1 3.042% 2.778% 2.513% 2.249% 1.984% 1.720% 1.455% 1.190% 0.926% 0.661% 0.397% 0.132% Year 2-7 3.175 3.175 3.175 3.175 3.175 3.175 3.175 3.175 3.175 3.175 3.175 3.175 Year 8 3.175 3.174 3.175 3.174 3.175 3.174 3.175 3.175 3.175 3.175 3.175 3.175 Year 9 3.174 3.175 3.174 3.175 3.174 3.175 3,174 3.175 3.174 3.175 3.174 3.175 Year 10 3.175 3.174 3.175 3.174 3.175 3.174 3.175 3.174 3.175 3.174 3.175 3.174 Year 11 3.174 3.175 3.174 3.175 3.174 3.175 3.174 3.175 3.174 3.175 3.174 3.175 Year 12 3.175 3.174 3.175 3.174 3.175 3.174 3.175 3.174 3.175 3.174 3.175 3.174 Year 13 3.174 3.175 3.174 3.175 3.174 3.175 3.174 3.175 3.174 3.175 3.174 3.175 Year 14 3.175 3.174 3.175 3.174 3.175 3.174 3.175 3.174 3.175 3.174 3.175 3.174 Year 15 3.174 3.175 3.174 3.175 3.174 3.175 3.174 3.175 3.174 3.175 3.174 3.175 Year 16 3.175 3.174 3.175 3.174 3.175 3.174 3.175 3.174 3.175 3.174 3.175 3.174 Year 17 3.174 3.175 3.174 3.175 3.174 3,175 3.174 3.175 3.174 3.175 3.174 3.175 Year 18 3.175 3.174 3.175 3.174 3.175 3.174 3.175 3.174 3.175 3.174 3.175 3.174 Year 19 3.174 3.175 3.174 3.175 3.174 3.175 3.174 3.175 3.174 3.175 3.174 3.175 Year 20 3.175 3.174 3.175 3.174 3.175 3.174 3.175 3.174 3.175 3.174 3.175 3.174 Year 21 3.174 3.175 3.174 3.175 3.174 3.175 3.174 3.175 3.174 3.175 3.174 3.175 Yoou 11 2 175 2 174 1 175 1 174 3 174 1 175 3 174 7 175 2 174 2 175 2 174 2175 BLE 5 Nonresidential Real Property Mid-Month Convention Straight Line-39 Years (for assets placed in service on or after May 13, 1993) Month Property Placed in Service Month 1 Month 2 Month 3 Month 4 Month 5 Month 6 Month 7 Month 8 Month 9 Month 10 Month 11 Month 12 Year 1 2.461% 2.247% 2.033% 1.819% 1.605% 1.391% 1.177% 0.963% 0.749% 0,535% 0.321% 0.107% Tear 2-39 2.564 2.564 2.564 2.564 2.564 2.564 2.564 2.564 2.564 2.564 2.564 2.564 Year 40 0.107 0.321 0.535 0.749 0.963 1.177 1.391 1.605 1.819 2.033 2.247 2.461 AMP Corporation (calendar-year-end) has 2019 taxable income of $1,900,000 for purposes of computing the $179 expense. During 2019, AMP acquired the following assets: (Use MACRS Table 1, Table 2, Table 3, Table 4 and Table 5.) Placed in Asset Service Basis Machinery Computer equipment Office building September 12 February 10 April 2 $1,520,000 480,000 595,000 Total $2,595,000 a. What is the maximum amount of $179 expense AMP may deduct for 2019? Maximum $179 expense deductible b. What is the maximum total depreciation, including $179 expense, that AMP may deduct in 2019 on the assets it placed in service in 2019, assuming no bonus depreciation? (Round your intermediate calculations to the nearest whole dollar amount.) Maximum total depreciation (including $179 expense) Table 1 MACRS Half-Year Convention Depreciation Rate for Recovery Period 3-Year 5-Year 7-Year 10-Year 15-Year 20-Year Year 1 Year 2 33.33% 20.00% 14.29% 10.00% 5.00% 3.750% 44.45 32.00 24.49 18.00 9.50 7.219 Year 3 14.81 19.20 17.49 14.40 8.55 6.677 Year 4 7.41 11.52 12.49 11.52 7.70 6.177 Year 5 11.52 8.93 9.22 6.93 5.713 Year 6 Year 7 Year 8 5.76 8.92 7.37 6.23 5.285 8.93 6.55 5.90 4.888 4.46 6.55 5.90 4.522 Year 9 6.56 5.91 4.462 Year 10 Year 11 Year 12 6.55 5.90 4.461 3.28 5.91 4.462 5.90 4.461 Year 13 5.91 4.462 Year 14 5.90 4.461 Year 15 5.91 4.462 Year 16 2.95 4.461 TABLE 2a MACRS Mid-Quarter Convention: For proper Depreciation Rate for Recovery Period 5-Year 7-Year Year 1 35.00% 25.00% Year 2 26.00 21.43 Year 3 15.60 15.31 Year 4 11.01 10.93 Year 5 11.01 8.75 Year 6 1.38 8.74 Year 7 8.75 Year 8 1.09 TABLE 2b MACRS Mid-Quarter Convention: For prope Depreciation Rate for Recovery Period 5-Year 7-Year Year 1 25.00% 17.85% Year 2 30.00 23.47 Year 3 18.00 16.76 Year 4 11.37 11.97 Voom 11. 27 O 07 TABLE 3 Residential Rental Property Mid-Month Convention Straight Line-27.5 Years Month Property Placed in Service Month 1 Month 2 Month 3 Month 4 Month 5 Month 6 Month 7 Month 8 Month 9 Month 10 Month 11 Month 12 Year 1 3.485% 3.182% 2.879% 2.576% 2.273% 1.970% 1.667% 1.364% 1.061% 0.758% 0.455% 0.152% Year 2-9 3.636 3.636 3.636 3.636 3.636 3.636 3.636 3.636 3.636 3.636 3.636 3.636 Year 10 3.637 3.637 3.637 3.637 3.637 3.637 3.636 3.636 3.636 3.636 3.636 3.636 Year 11 3.636 3.636 3.636 3.636 3.636 3.636 3.637 3.637 3.637 3.637 3.637 3.637 Year 12 3.637 3.637 3.637 3.637 3.637 3.637 3.636 3.636 3.636 3.636 3.636 3.636 Year 13 3.636 3.636 3.636 3.636 3.636 3.636 3.637 3.637 3.637 3.637 3.637 3.637 Year 14 3.637 3.637 3.637 3.637 3.637 3.637 3.636 3.636 3.636 3.636 3.636 3.636 Year 15 3.636 3.636 3.636 3.636 3.636 3.636 3.637 3.637 3.637 3.637 3.637 3.637 Year 16 3.637 3.637 3.637 3.637 3.637 3.637 3.636 3.636 3.636 3.636 3.636 3.636 Year 17 3.636 3.636 3.636 3.636 3.636 3.636 3.637 3.637 3.637 3.637 3.637 3.637 Year 18 3.637 3.637 3.637 3.637 3.637 3.637 3.636 3.636 3.636 3.636 3.636 3.636 Year 19 3.636 3.636 3.636 3.636 3.636 3,636 3.637 3.637 3.637 3.637 3.637 3.637 Year 20 3.637 3.637 3.637 3.637 3.637 3.637 3.636 3.636 3.636 3.636 3.636 3.636 Year 21 3.636 3.636 3.636 3.636 3.636 3.636 3.637 3.637 3.637 3.637 3.637 3.637 Year 22 3.637 3.637 3.637 3.637 3.637 3.637 3.636 3.636 3.636 3.636 3.636 3.636 Yoon 13 3 636 1 636 3 636 3 636 3 636 1 636 3 627 1 67 3 627 3 637 3 637 3637 ABLE 4 Nonresidential Real Property Mid-Month Convention Straight Line-31.5 Years (for assets placed in service before May 13, 1993) Month Property Placed in Service Month 1 Month 2 Month 3 Month 4 Month 5 Month 6 Month 7 Month 8 Month 9 Month 10 Month 11 Month 12 Year 1 3.042% 2.778% 2.513% 2.249% 1.984% 1.720% 1.455% 1.190% 0.926% 0.661% 0.397% 0.132% Year 2-7 3.175 3.175 3.175 3.175 3.175 3.175 3.175 3.175 3.175 3.175 3.175 3.175 Year 8 3.175 3.174 3.175 3.174 3.175 3.174 3.175 3.175 3.175 3.175 3.175 3.175 Year 9 3.174 3.175 3.174 3.175 3.174 3.175 3,174 3.175 3.174 3.175 3.174 3.175 Year 10 3.175 3.174 3.175 3.174 3.175 3.174 3.175 3.174 3.175 3.174 3.175 3.174 Year 11 3.174 3.175 3.174 3.175 3.174 3.175 3.174 3.175 3.174 3.175 3.174 3.175 Year 12 3.175 3.174 3.175 3.174 3.175 3.174 3.175 3.174 3.175 3.174 3.175 3.174 Year 13 3.174 3.175 3.174 3.175 3.174 3.175 3.174 3.175 3.174 3.175 3.174 3.175 Year 14 3.175 3.174 3.175 3.174 3.175 3.174 3.175 3.174 3.175 3.174 3.175 3.174 Year 15 3.174 3.175 3.174 3.175 3.174 3.175 3.174 3.175 3.174 3.175 3.174 3.175 Year 16 3.175 3.174 3.175 3.174 3.175 3.174 3.175 3.174 3.175 3.174 3.175 3.174 Year 17 3.174 3.175 3.174 3.175 3.174 3,175 3.174 3.175 3.174 3.175 3.174 3.175 Year 18 3.175 3.174 3.175 3.174 3.175 3.174 3.175 3.174 3.175 3.174 3.175 3.174 Year 19 3.174 3.175 3.174 3.175 3.174 3.175 3.174 3.175 3.174 3.175 3.174 3.175 Year 20 3.175 3.174 3.175 3.174 3.175 3.174 3.175 3.174 3.175 3.174 3.175 3.174 Year 21 3.174 3.175 3.174 3.175 3.174 3.175 3.174 3.175 3.174 3.175 3.174 3.175 Yoou 11 2 175 2 174 1 175 1 174 3 174 1 175 3 174 7 175 2 174 2 175 2 174 2175 BLE 5 Nonresidential Real Property Mid-Month Convention Straight Line-39 Years (for assets placed in service on or after May 13, 1993) Month Property Placed in Service Month 1 Month 2 Month 3 Month 4 Month 5 Month 6 Month 7 Month 8 Month 9 Month 10 Month 11 Month 12 Year 1 2.461% 2.247% 2.033% 1.819% 1.605% 1.391% 1.177% 0.963% 0.749% 0,535% 0.321% 0.107% Tear 2-39 2.564 2.564 2.564 2.564 2.564 2.564 2.564 2.564 2.564 2.564 2.564 2.564 Year 40 0.107 0.321 0.535 0.749 0.963 1.177 1.391 1.605 1.819 2.033 2.247 2.461
Expert Answer:

Related Book For 

Essentials of Federal Taxation 2019
ISBN: 9781260190045
10th edition
Authors: Brian Spilker, Benjamin Ayers, John Robinson, Edmund Outslay, Ronald Worsham, John Barrick, Connie Weaver
Posted Date:
Students also viewed these accounting questions
-
AMP Corporation (calendar-year-end) has 2019 taxable income of $1,900,000 for purposes of computing the 179 expense. During 2019, AMP acquired the following assets: Placed in Asset Service Basis...
-
What is the maximum amount of interest to be capitalized under IFRS?
-
What is the maximum amount of foreign tax credit that a company will be allowed to take with respect to the income earned by a foreign operation?
-
The rotating beacon of a parked police car is 12 m from a straight wall. (a) Sketch the graph of the length L of the light beam, where L = 12 sec t, for 0 t 2.0 s. (b) Which part(s) of the graph...
-
Treatment of hydroxylamine (H2NOH) with an excess of Fe(III) results in the formation of N2O and an equivalent amount of Fe(II): 2H2NOH + 4Fe3+ ( N2O(g) + 4Fe2+ +4H+ + H2O
-
Petra provides the following information, which has been extracted from her books of prime entry on 31 July 20*8: Required Prepare a sales ledger control account for the month of July 20*8. 9,600...
-
What happens if the conducting rod in Figure P29.1 moves \((a)\) in either direction along the \(z\) axis and \((b)\) in either direction along the \(y\) axis? Data from Figure P29.1 B
-
Accounting for Bad Debts Badger recorded $500,000 of net sales for the year of which 2% is estimated to be uncollectible. Identify and analyze the adjustment required at the end of the year to record...
-
Question Two. Evaluate the levels of management Question Three. [15 marks] A chief executive officer cannot perform all the activities in organization; discuss the importance of the organizing...
-
Honda Motor Corporation of Japan is a leading international manufacturer of automobiles, motorcycles, all-terrain vehicles, and personal watercraft. As a Japanese company, it follows Japanese GAAP...
-
Rewrite each equation as requested. (a) Rewrite as an exponential equation. In 9 = y (b) Rewrite as a logarithmic equation. e* = 7
-
Arizona offers unique opportunities for direct democracy based on initiative power. In 2012 the Arizona voters, for example, rejected the Proposition 204 initiative that sought to convert a temporary...
-
It is now July 2024. You sold a futures contract in October for $5.00, but the July contract price is now $5.50. The cash price offered by your local flour mill is $5.70. Your actual production is...
-
As a rational investor, you have just purchased a bond from a broker for $990. The bond has 6 years to maturity and a 12.1% coupon rate. What can you comment about the price you paid for the bond?...
-
Find the curvature of r(t) at the point (1, 1, 1). r(t) = (t. 4.436 k =
-
1) Write a function named "Countstr" that operates over a list which includes a series of strings. The function takes a string and outputs the number of occurrences of that string in the given list....
-
How does the implementation of Kaizen philosophy contribute to the perpetuation of continuous improvement within complex organizational structures?
-
Derive Eq. (18.33) from Eq. (18.32).
-
Jamel and Jennifer have been married 30 years and have filed a joint return every year of their marriage. Their three daughters, Jade, Lindsay, and Abbi, are ages 12, 17, and 22, respectively, and...
-
Virginia Corporation is a calendar-year corporation. At the beginning of 2018, its election to be taxed as an S corporation became effective. Virginia Corp.s balance sheet at the end of 2017...
-
Sylvester files as a single taxpayer during 2018. He itemizes deductions for regular tax purposes. He paid charitable contributions of $7,000, real estate taxes of $1,000, state income taxes of...
-
True or False: Annual worth analysis is the most popular DCF measure of economic worth.
-
Consider a palletizer at a bottling plant that has a first cost of \($150,000,\) operating and maintenance costs of \($17,500\) per year, and an estimated net salvage value of \($25,000\) at the end...
-
True or False: Unless non-monetary considerations dictate otherwise, choose the mutually exclusive investment alternative that has the greatest annual worth over the planning horizon.

Study smarter with the SolutionInn App