

Based on the annual revenue of Alibaba Group from the financial year 2010 to 2020 as shown
Fantastic news! We've Found the answer you've been seeking!
Question:
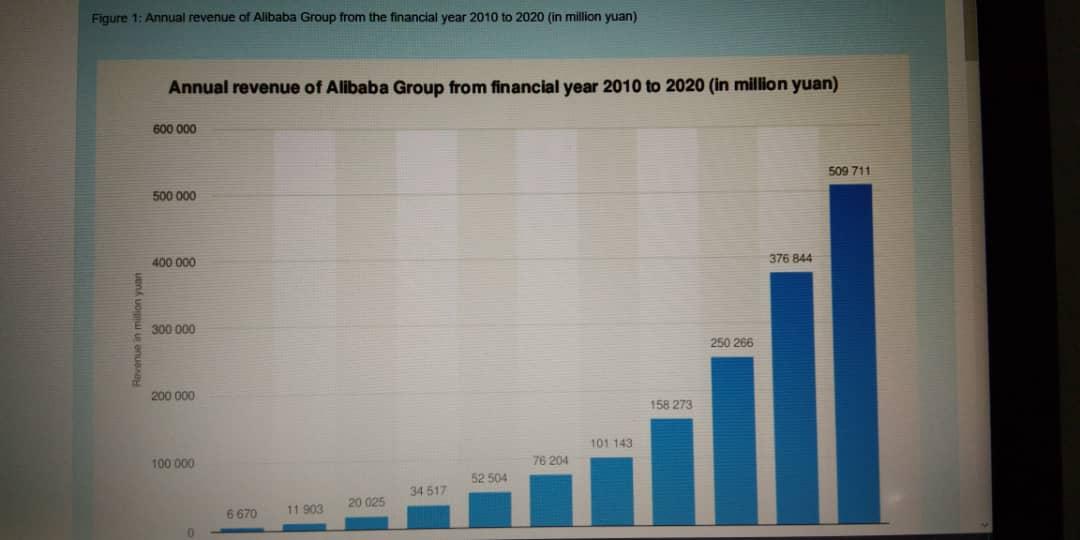
Based on the annual revenue of Alibaba Group from the financial year 2010 to 2020 as shown in Figure 1, describe the evolution of Alibaba Group.
Figure 1: Annual revenue of Alibaba Group from the financial year 2010 to 2020 (in million yuan)
Source: Statista Research Department, May 22, 2020.
Expert Answer:

Related Book For 

Income Tax Fundamentals 2013
ISBN: 9781285586618
31st Edition
Authors: Gerald E. Whittenburg, Martha Altus Buller, Steven L Gill
Posted Date:
