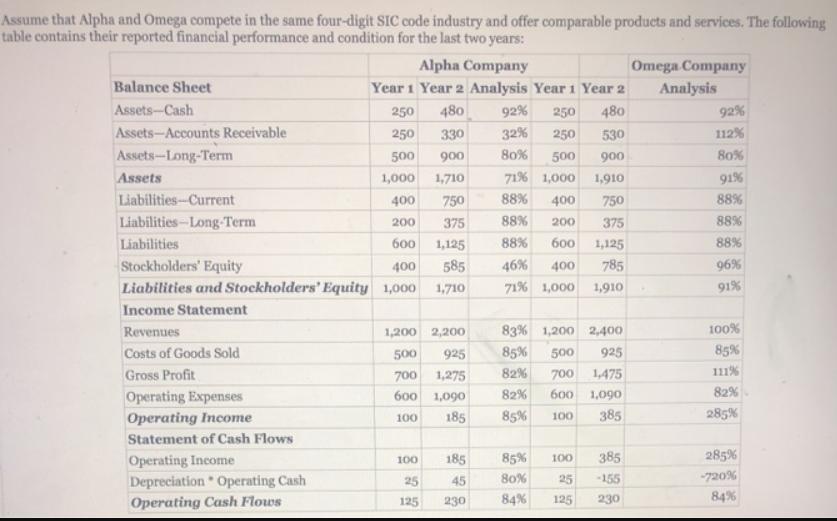
? ?? ? ? Assume that Alpha and Omega compete in the same four-digit SIC code industry and offer comparable products and services. The following

Answered step by step Verified Expert Solution
Question
75 users unlocked this solution today!

? image??

?image?

Assume that Alpha and Omega compete in the same four-digit SIC code industry and offer comparable products and services. The following table contains their reported financial performance and condition for the last two years: Balance Sheet Assets-Cash Assets-Accounts Receivable Assets-Long-Term Assets Liabilities-Current Liabilities-Long-Term Liabilities Stockholders' Equity 400 Liabilities and Stockholders' Equity 1,000 Income Statement Revenues Costs of Goods Sold Gross Profit Operating Expenses Operating Income Statement of Cash Flows Operating Income Alpha Company Year 1 Year 2 Analysis Year 1 Year 2 250 480 250 330 500 900 1,000 1,710 400 750 200 375 600 1,125 585 Depreciation Operating Cash Operating Cash Flows 1,200 500 700 600 100 100 25 125 1,710 2,200 925 1,275 1,090 92% 250 480 32% 250 530 80% 900 1,910 185 45 230 500 71% 1,000 88% 750 88% 375 88% 600 1,125 46% 400 785 71% 1,000 1,910 83% 1,200 2,400 85% 500 925 82% 700 1,475 82% 600 1,090 185 85% 100 385 400 200 85% 80% 84% 100 25 125 385 -155 230 Omega Company Analysis 92% 112% 80% 91% 88% 88% 88% 96% 91% 100% 85% 111% 82% 285% 285% -720% 84% 1. Using the financial statement data provided, complete the following assignments: a. Describe any symptoms of fraud b. Draw a conclusion about fraud predication and recommend next steps. 2. Assume that industry ratios were derived from a reputable source. Compute the year 1 and year 2 ratios for Alpha and Omega: Ratios Current Ratio Debt-to-Assets Ratio Return on Assets Gross Margin Operating Cash Flow/Income Dupont Expression Ratios Risk-Assets-to-Equity Alpha Company Year 1 Year 2 Industry Year 1 Year 2 0.63 0.64 0.600 0.658 11% 10% 58% 58% 125% 124% 2.50 2.92 1.29 8% 1.15 0.63 0.64 0.625 0.600 0.589 10% 58% 125% 10% 20% 58% 61% 125% 60% 2.50 2.43 1.20 1.26 8% 16% Omega Company Industry 1.15 0.625 10% 58% 125% 2.75 1.25 8% 27% 2.75 Revenue Generation-Asset Turn 1.20 1.25 Profits-Profit Margin 8% 8% Return on Equity 25% 32% 27% 25% 49% 3. Using your calculated ratios from assignment 2 in concert with the metrics calculated in assignment 1, complete the following assignments: a. Describe any symptoms of fraud b. Combine the findings in the ratio analysis with the metrics calculated in assignment 1 and draw a conclusion about fraud predication and recommend next steps. EXTRE, fo Alaha and 4. Assume that nonfinancial metrics were derived from reliable public and internal sources. Complete the analysis of NFMs for Alpha and Omega: Alpha Company Omega Company Analysis Analysis of Nonfinancial Metrics Year 1 Year 2 Analysis Year 1 Year 2 Retail Square Footage 57,000 105,000 84% 57,000 105,000 84% # Employees 1,140 82% 1,140 2,075 82% #Store Locations 95 79% 95 170 79% 5. Using your calculated metrics from assignments 1 an 2 in concert with the metrics calculated in assignment 4, complete the following assignments: 2,075 170 a. Describe any symptoms of fraud b. Combine the findings in the NFMs with the ratio analysis computed in assignment 2 and percentages calculated in assignment 1 and draw a conclusion about fraud predication and recommend next steps.

Step by Step Solution

3.61 Rating (212 Votes )

There are 3 Steps involved in it

1 Expert Approved Answer
Link Copied!
Step: 1

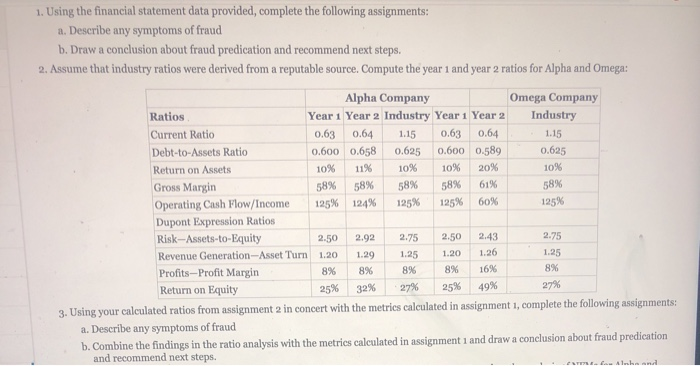
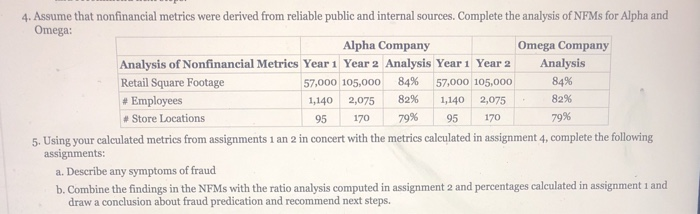
1 a The data for both Alpha and Omega firms contain a number of possible fraud indicators With no equivalent rise in other assets Alphas balance sheet shows a huge increase in cash from year 1 to year ... View full answer

blur-text-image
Question Has Been Solved by an Expert!

Get step-by-step solutions from verified subject matter experts

100% Satisfaction Guaranteed-or Get a Refund!

Step: 2Unlock detailed examples and clear explanations to master concepts
blur-text-image_2
Step: 3Unlock to practice, ask and learn with real-world examples
blur-text-image_3

See step-by-step solutions with expert insights and AI powered tools for academic success

  • tick Icon Access 30 Million+ textbook solutions.
  • tick Icon Ask unlimited questions from AI Tutors.
  • tick Icon Order free textbooks.
  • tick Icon 100% Satisfaction Guaranteed-or Get a Refund!

Students Have Also Explored These Related Accounting Questions!

Claim Your Hoodie Now!

Order Now

Recommended Textbook for

Economics

Economics

Authors: Campbell R. McConnell, Stanley L. Brue, Sean M. Flynn

18th edition

978-0077413798, 0-07-336880-6, 77413792, 978-0-07-33688, 978-0073375694

More Books
flashcard-anime

Study Smart with AI Flashcards

Access a vast library of flashcards, create your own, and experience a game-changing transformation in how you learn and retain knowledge

Explore Flashcards