

The Martin-Beck Company operates a plant in St. Louis with an annual capacity of 30,000 units....
Fantastic news! We've Found the answer you've been seeking!
Question:

Transcribed Image Text:
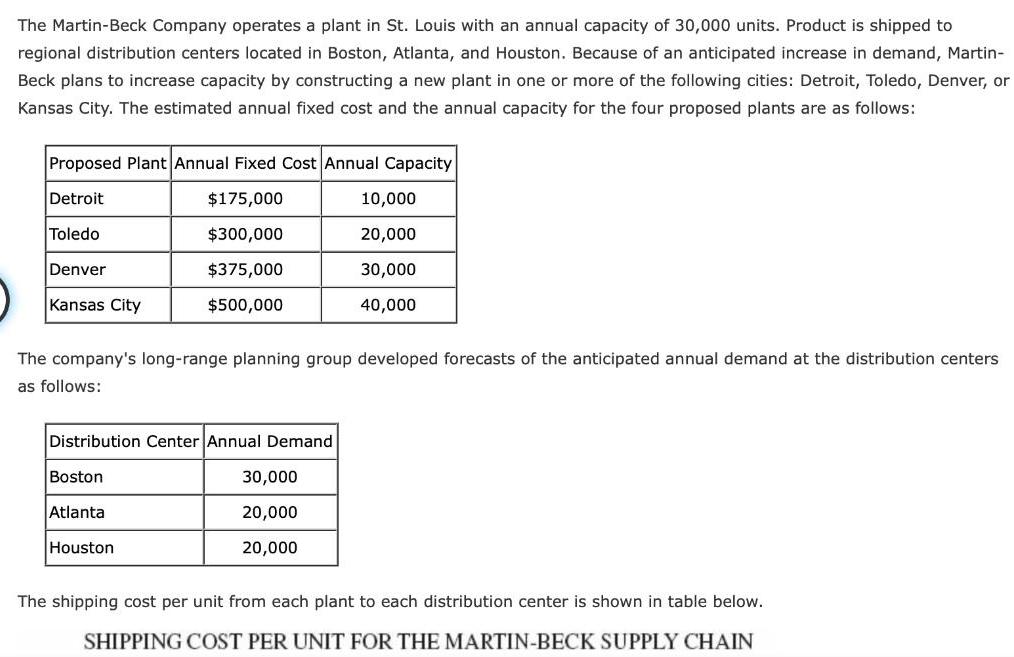
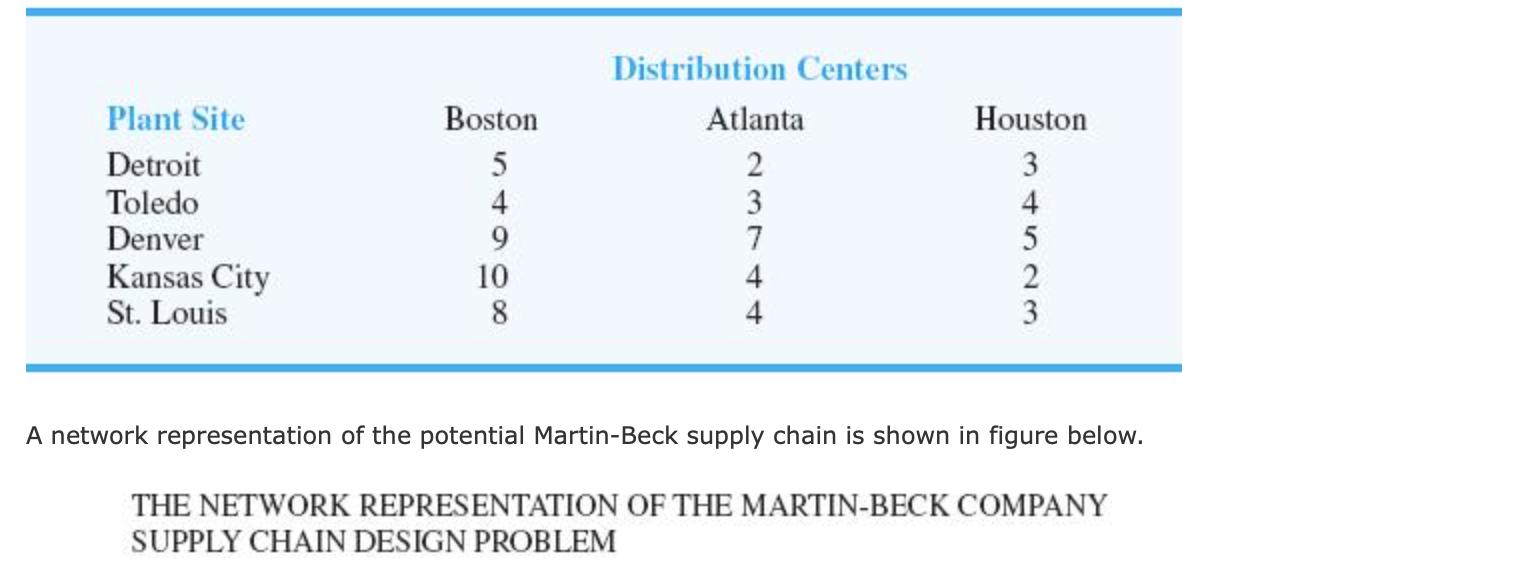
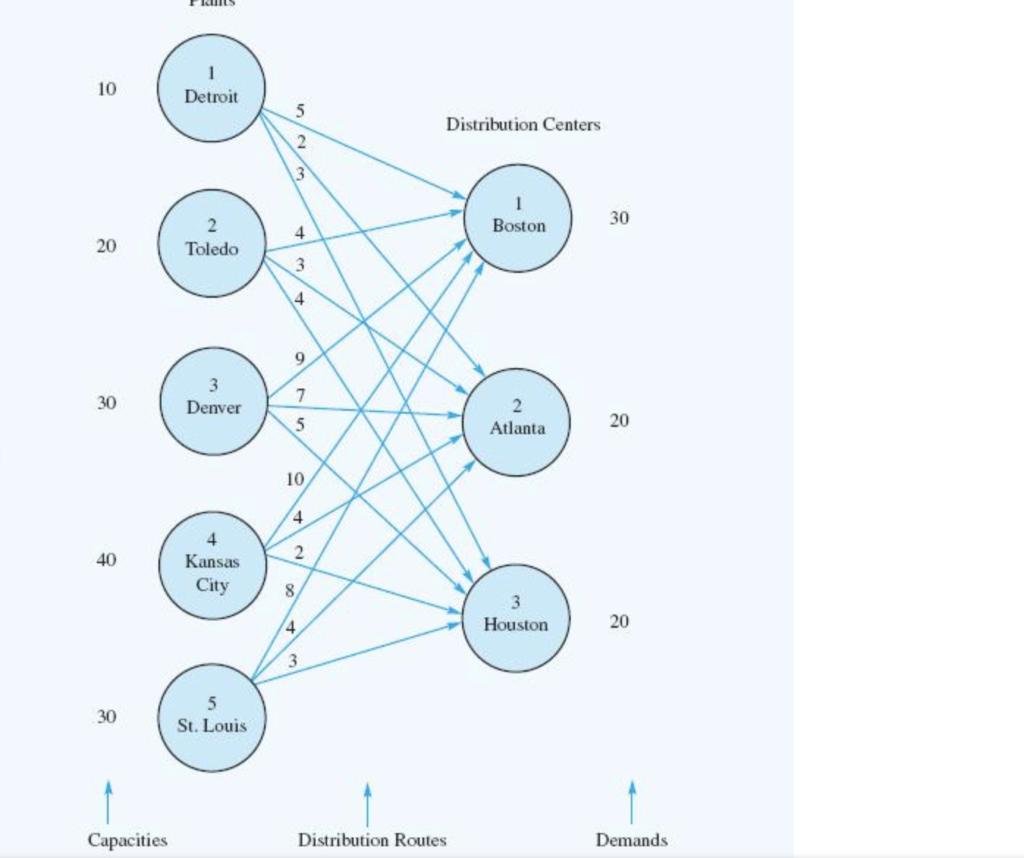
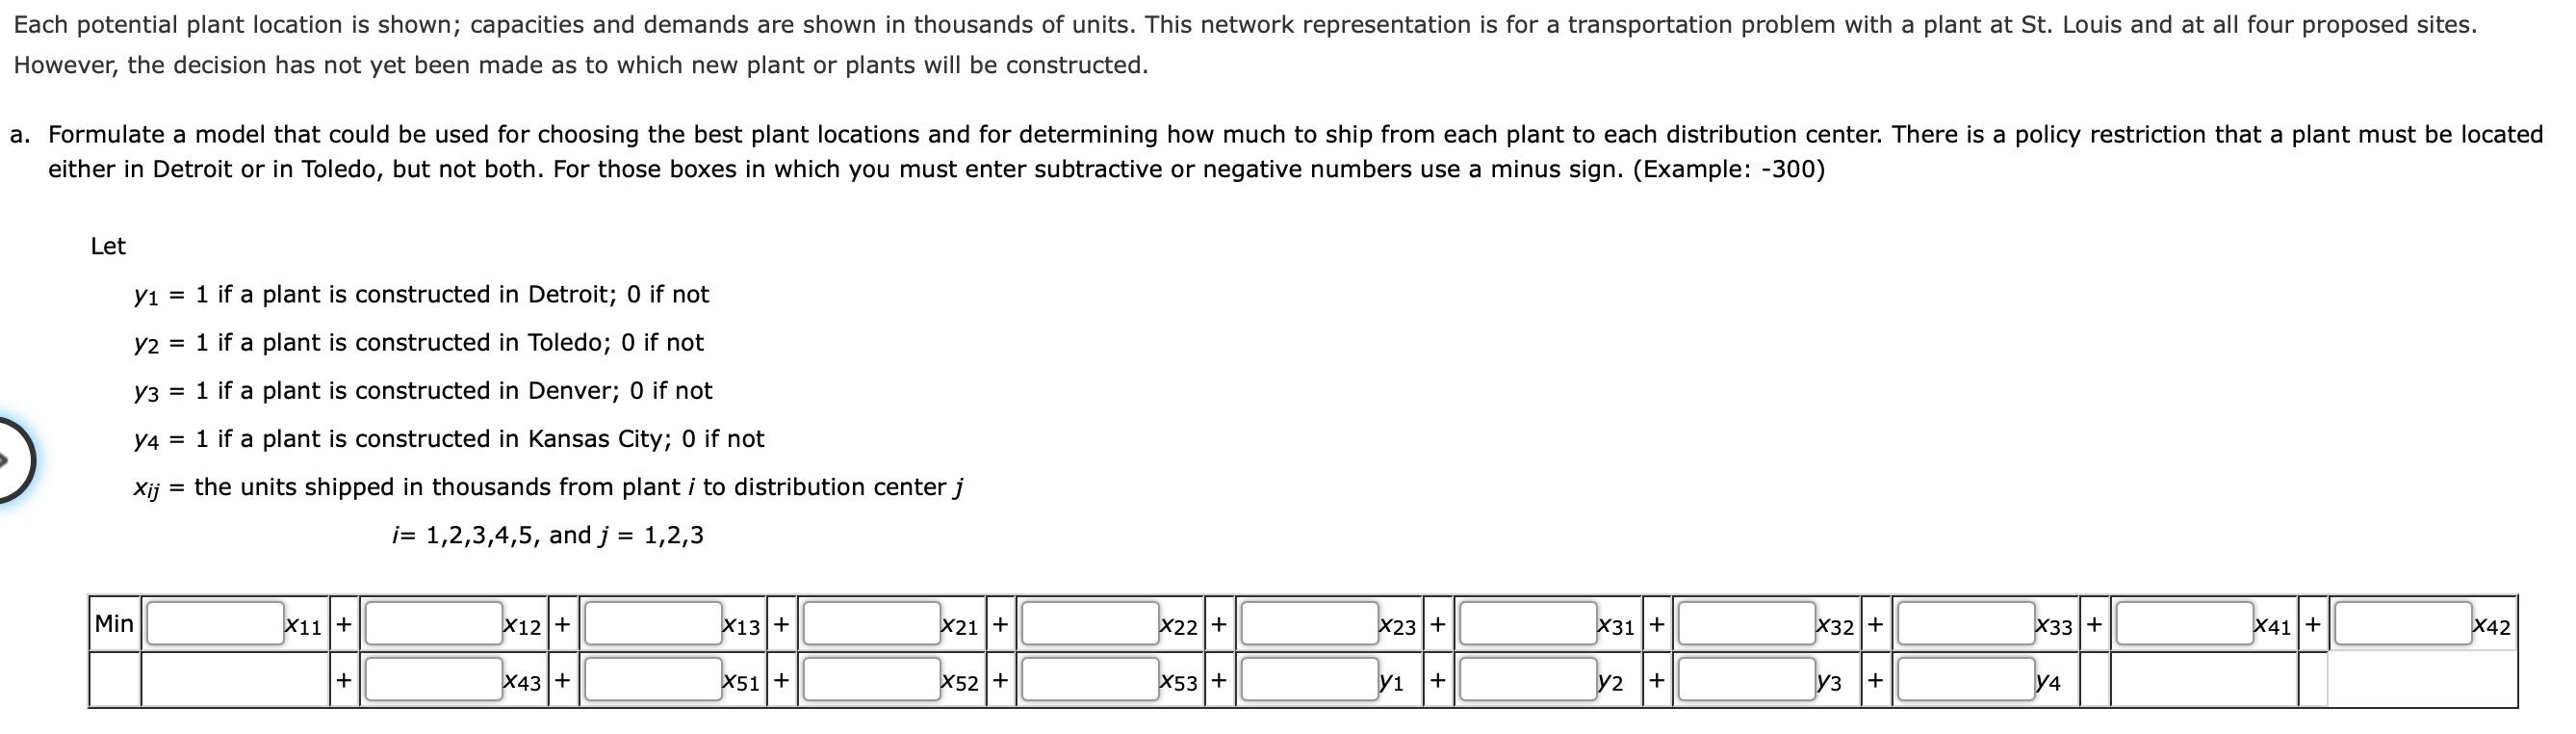
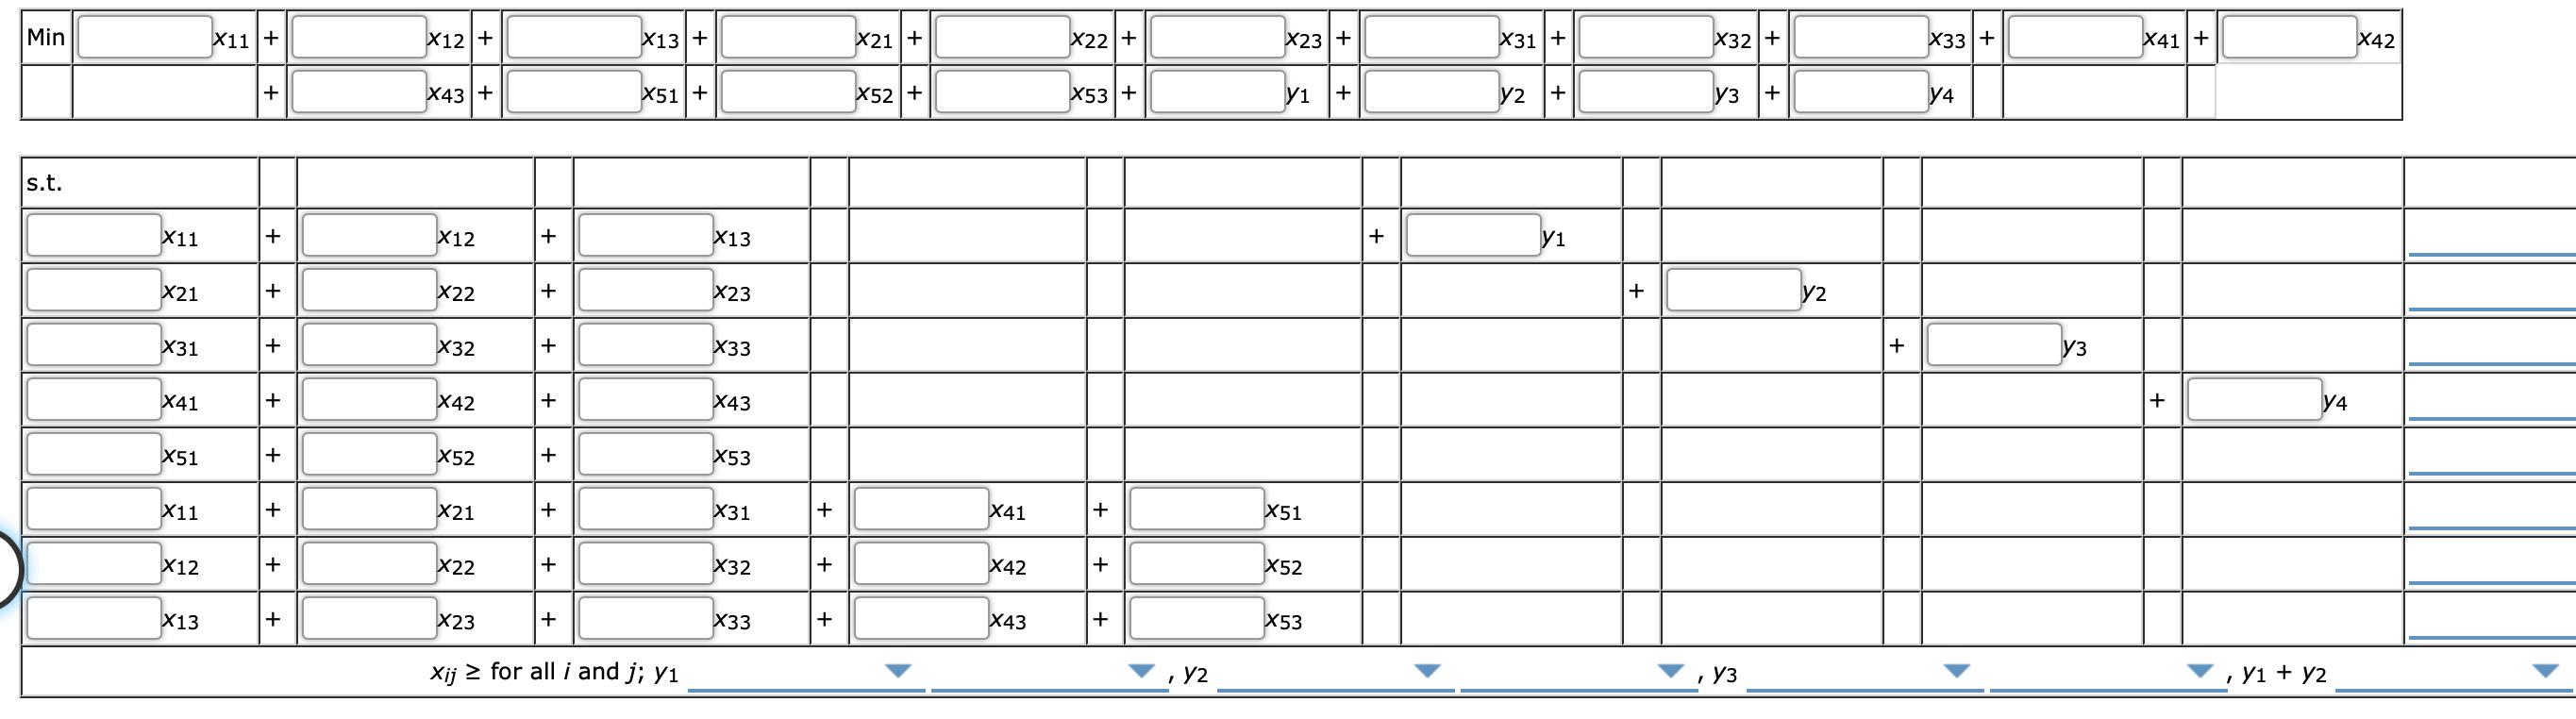
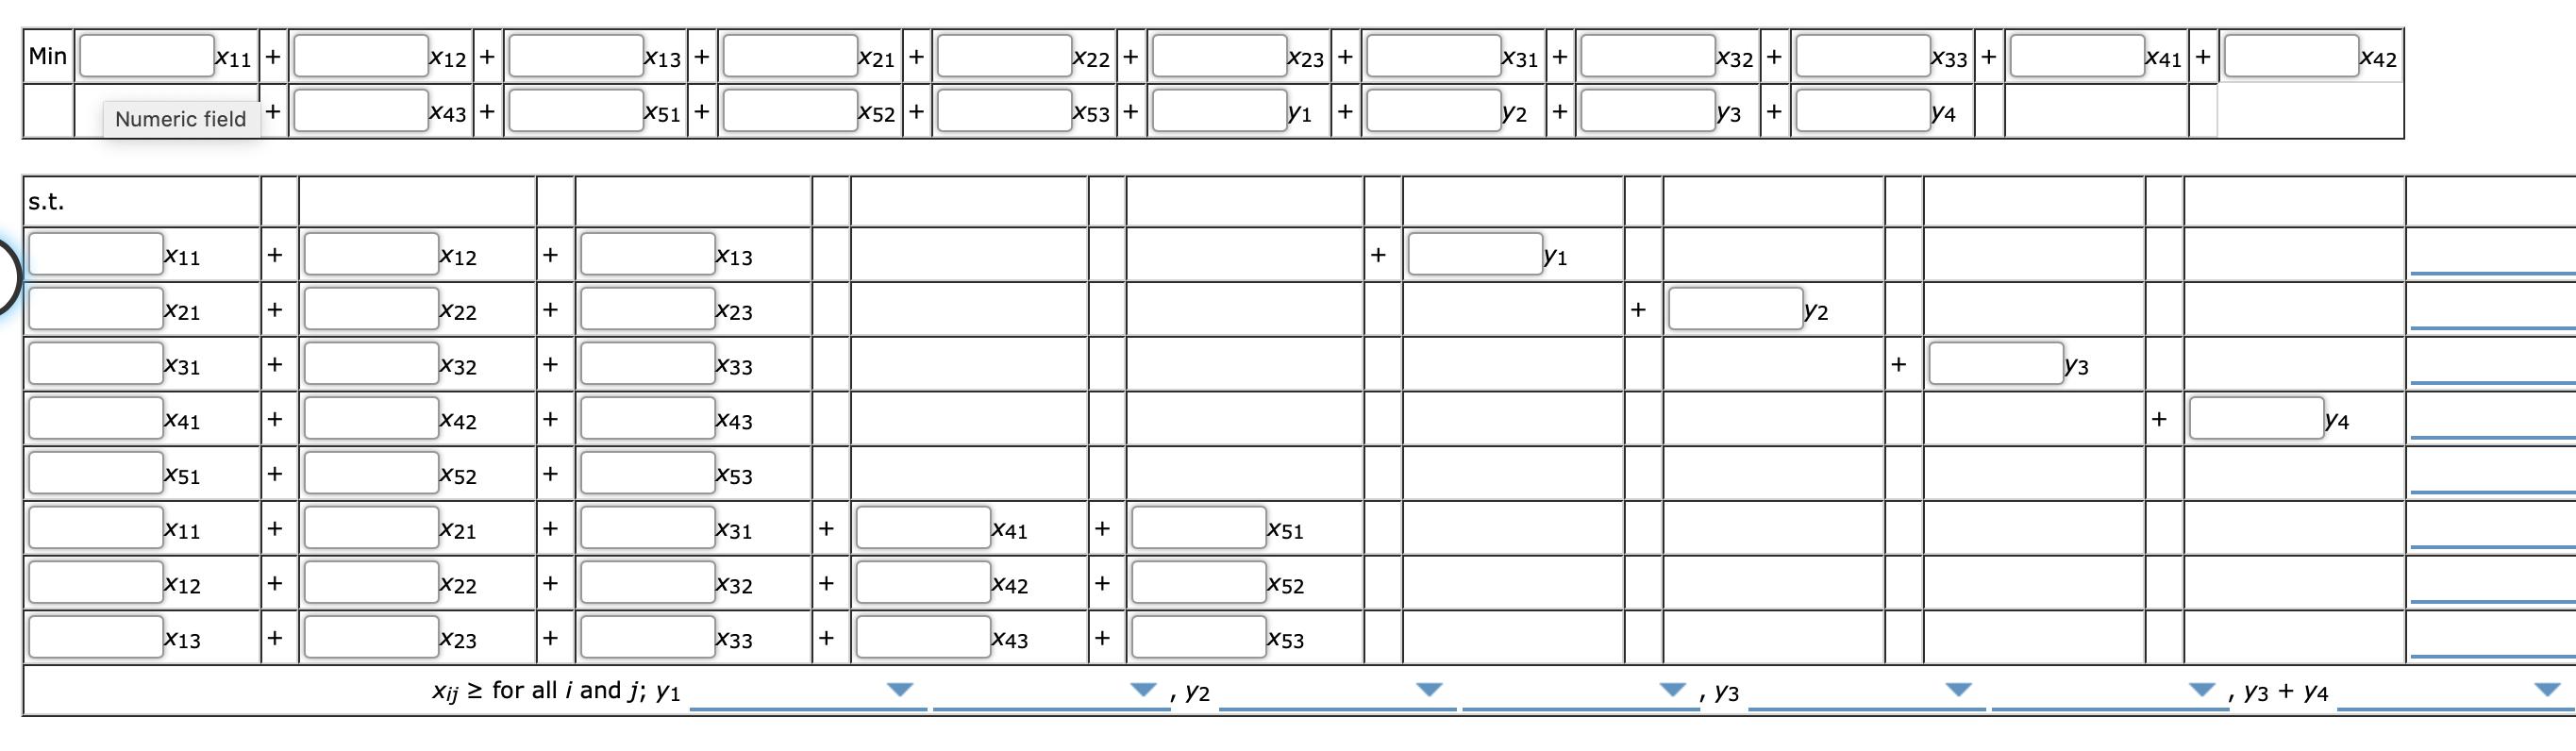
The Martin-Beck Company operates a plant in St. Louis with an annual capacity of 30,000 units. Product is shipped to regional distribution centers located in Boston, Atlanta, and Houston. Because of an anticipated increase in demand, Martin- Beck plans to increase capacity by constructing a new plant in one or more of the following cities: Detroit, Toledo, Denver, or Kansas City. The estimated annual fixed cost and the annual capacity for the four proposed plants are as follows: Proposed Plant Annual Fixed Cost Annual Capacity Detroit $175,000 10,000 Toledo $300,000 20,000 Denver $375,000 30,000 Kansas City $500,000 40,000 The company's long-range planning group developed forecasts of the anticipated annual demand at the distribution centers as follows: Distribution Center Annual Demand Boston 30,000 Atlanta 20,000 Houston 20,000 The shipping cost per unit from each plant to each distribution center is shown in table below. SHIPPING COST PER UNIT FOR THE MARTIN-BECK SUPPLY CHAIN Distribution Centers ETTT Plant Site Boston Atlanta Houston Detroit 2 3 Toledo Denver 4 3 7 4 5 Kansas City St. Louis 10 8. 4 4 2 3 A network representation of the potential Martin-Beck supply chain is shown in figure below. THE NETWORK REPRESENTATION OF THE MARTIN-BECK COMPANY SUPPLY CHAIN DESIGN PROBLEM 10 Detroit Distribution Centers 30 Boston 4 20 Toledo 3. 4 9 7 30 Denver 5 Atlanta 20 10 4. 40 Kansas City 8. Houston 20 3. 30 St. Louis Сараcities Distribution Routes Demands - Each potential plant location is shown; capacities and demands are shown in thousands of units. This network representation is for a transportation problem with a plant at St. Louis and at all four proposed sites. However, the decision has not yet been made as to which new plant or plants will be constructed. a. Formulate a model that could be used for choosing the best plant locations and for determining how much to ship from each plant to each distribution center. There is a policy restriction that a plant must be located either in Detroit or in Toledo, but not both. For those boxes in which you must enter subtractive or negative numbers use a minus sign. (Example: -300) Let y1 = 1 if a plant is constructed in Detroit; 0 if not y2 = 1 if a plant is constructed in Toledo; 0 if not y3 = 1 if a plant is constructed in Denver; 0 if not y4 = 1 if a plant is constructed in Kansas City; 0 if not Xij = the units shipped in thousands from plant i to distribution center j i= 1,2,3,4,5, and j = 1,2,3 Min X11+ X12 + X13 + X21 + X22+ X23 + X31 + X32 + X33 + X41+ X42 + X43 + X51+ X52 + X53+ Y2 + y3 + y4 + Min X11+ X12+ X13 + X21 + X22 + X23+ X31 + X32+ X33 + X41+ X42 X43 + X51+ X52 + X53 + yi + y2 y3 y4 s.t. X11 + X12 + X13 + y1 X21 + X22 X23 + y2 X31 X32 X33 y3 y4 X41 + X42 + X43 X51 + X52 + X53 X11 X21 +1 X31 + X41 + X51 X12 + X22 X42 X52 + X32 + + X13 X23 X33 + X43 X53 Xij 2 for all i i and j; y1 , Y2 , УЗ , Y1 + y2 + + + b. Formulate a model that could be used for choosing the best plant locations and for determining how much to ship from each plant to each distribution center. There is a policy restriction that no more than two plants can be located in Denver, Kansas City, and St. Louis. For those boxes in which you must enter subtractive or negative numbers use a minus sign. (Example: -300) Let yi = 1 if a plant is constructed in Detroit; 0 if not y2 = 1 if a plant is constructed in Toledo; 0 if not y3 = 1 if a plant is constructed in Denver; 0 if not y4 = 1 if a plant is constructed in Kansas City; 0 if not Xij the units shipped in thousands from plant i to distribution center j %3D i= 1,2,3,4,5, and j = 1,2,3 Min X11+ X12 + X13 + X21+ X22+ X23 + X31 + X32 + X33 + X41 + X42 X43 + X51+ X52 + X53 + y1 y2 y3 + Numeric field + + y4 s.t. X11 X12 X13 + X21 X22 X23 + y2 X31 + X32 X33 y3 X41 X42 +1 X43 y4 X51 + X52 + X53 X11 X21 X31 X41 X51 X12 + X22 X32 X42 X52 X13 + X23 X33 X43 X53 Xij 2 for all i and j; y1 , Y2 , Уз , Уз + у4 + + + + + + + + + + + + The Martin-Beck Company operates a plant in St. Louis with an annual capacity of 30,000 units. Product is shipped to regional distribution centers located in Boston, Atlanta, and Houston. Because of an anticipated increase in demand, Martin- Beck plans to increase capacity by constructing a new plant in one or more of the following cities: Detroit, Toledo, Denver, or Kansas City. The estimated annual fixed cost and the annual capacity for the four proposed plants are as follows: Proposed Plant Annual Fixed Cost Annual Capacity Detroit $175,000 10,000 Toledo $300,000 20,000 Denver $375,000 30,000 Kansas City $500,000 40,000 The company's long-range planning group developed forecasts of the anticipated annual demand at the distribution centers as follows: Distribution Center Annual Demand Boston 30,000 Atlanta 20,000 Houston 20,000 The shipping cost per unit from each plant to each distribution center is shown in table below. SHIPPING COST PER UNIT FOR THE MARTIN-BECK SUPPLY CHAIN Distribution Centers ETTT Plant Site Boston Atlanta Houston Detroit 2 3 Toledo Denver 4 3 7 4 5 Kansas City St. Louis 10 8. 4 4 2 3 A network representation of the potential Martin-Beck supply chain is shown in figure below. THE NETWORK REPRESENTATION OF THE MARTIN-BECK COMPANY SUPPLY CHAIN DESIGN PROBLEM 10 Detroit Distribution Centers 30 Boston 4 20 Toledo 3. 4 9 7 30 Denver 5 Atlanta 20 10 4. 40 Kansas City 8. Houston 20 3. 30 St. Louis Сараcities Distribution Routes Demands - Each potential plant location is shown; capacities and demands are shown in thousands of units. This network representation is for a transportation problem with a plant at St. Louis and at all four proposed sites. However, the decision has not yet been made as to which new plant or plants will be constructed. a. Formulate a model that could be used for choosing the best plant locations and for determining how much to ship from each plant to each distribution center. There is a policy restriction that a plant must be located either in Detroit or in Toledo, but not both. For those boxes in which you must enter subtractive or negative numbers use a minus sign. (Example: -300) Let y1 = 1 if a plant is constructed in Detroit; 0 if not y2 = 1 if a plant is constructed in Toledo; 0 if not y3 = 1 if a plant is constructed in Denver; 0 if not y4 = 1 if a plant is constructed in Kansas City; 0 if not Xij = the units shipped in thousands from plant i to distribution center j i= 1,2,3,4,5, and j = 1,2,3 Min X11+ X12 + X13 + X21 + X22+ X23 + X31 + X32 + X33 + X41+ X42 + X43 + X51+ X52 + X53+ Y2 + y3 + y4 + Min X11+ X12+ X13 + X21 + X22 + X23+ X31 + X32+ X33 + X41+ X42 X43 + X51+ X52 + X53 + yi + y2 y3 y4 s.t. X11 + X12 + X13 + y1 X21 + X22 X23 + y2 X31 X32 X33 y3 y4 X41 + X42 + X43 X51 + X52 + X53 X11 X21 +1 X31 + X41 + X51 X12 + X22 X42 X52 + X32 + + X13 X23 X33 + X43 X53 Xij 2 for all i i and j; y1 , Y2 , УЗ , Y1 + y2 + + + b. Formulate a model that could be used for choosing the best plant locations and for determining how much to ship from each plant to each distribution center. There is a policy restriction that no more than two plants can be located in Denver, Kansas City, and St. Louis. For those boxes in which you must enter subtractive or negative numbers use a minus sign. (Example: -300) Let yi = 1 if a plant is constructed in Detroit; 0 if not y2 = 1 if a plant is constructed in Toledo; 0 if not y3 = 1 if a plant is constructed in Denver; 0 if not y4 = 1 if a plant is constructed in Kansas City; 0 if not Xij the units shipped in thousands from plant i to distribution center j %3D i= 1,2,3,4,5, and j = 1,2,3 Min X11+ X12 + X13 + X21+ X22+ X23 + X31 + X32 + X33 + X41 + X42 X43 + X51+ X52 + X53 + y1 y2 y3 + Numeric field + + y4 s.t. X11 X12 X13 + X21 X22 X23 + y2 X31 + X32 X33 y3 X41 X42 +1 X43 y4 X51 + X52 + X53 X11 X21 X31 X41 X51 X12 + X22 X32 X42 X52 X13 + X23 X33 X43 X53 Xij 2 for all i and j; y1 , Y2 , Уз , Уз + у4 + + + + + + + + + + + + The Martin-Beck Company operates a plant in St. Louis with an annual capacity of 30,000 units. Product is shipped to regional distribution centers located in Boston, Atlanta, and Houston. Because of an anticipated increase in demand, Martin- Beck plans to increase capacity by constructing a new plant in one or more of the following cities: Detroit, Toledo, Denver, or Kansas City. The estimated annual fixed cost and the annual capacity for the four proposed plants are as follows: Proposed Plant Annual Fixed Cost Annual Capacity Detroit $175,000 10,000 Toledo $300,000 20,000 Denver $375,000 30,000 Kansas City $500,000 40,000 The company's long-range planning group developed forecasts of the anticipated annual demand at the distribution centers as follows: Distribution Center Annual Demand Boston 30,000 Atlanta 20,000 Houston 20,000 The shipping cost per unit from each plant to each distribution center is shown in table below. SHIPPING COST PER UNIT FOR THE MARTIN-BECK SUPPLY CHAIN Distribution Centers ETTT Plant Site Boston Atlanta Houston Detroit 2 3 Toledo Denver 4 3 7 4 5 Kansas City St. Louis 10 8. 4 4 2 3 A network representation of the potential Martin-Beck supply chain is shown in figure below. THE NETWORK REPRESENTATION OF THE MARTIN-BECK COMPANY SUPPLY CHAIN DESIGN PROBLEM 10 Detroit Distribution Centers 30 Boston 4 20 Toledo 3. 4 9 7 30 Denver 5 Atlanta 20 10 4. 40 Kansas City 8. Houston 20 3. 30 St. Louis Сараcities Distribution Routes Demands - Each potential plant location is shown; capacities and demands are shown in thousands of units. This network representation is for a transportation problem with a plant at St. Louis and at all four proposed sites. However, the decision has not yet been made as to which new plant or plants will be constructed. a. Formulate a model that could be used for choosing the best plant locations and for determining how much to ship from each plant to each distribution center. There is a policy restriction that a plant must be located either in Detroit or in Toledo, but not both. For those boxes in which you must enter subtractive or negative numbers use a minus sign. (Example: -300) Let y1 = 1 if a plant is constructed in Detroit; 0 if not y2 = 1 if a plant is constructed in Toledo; 0 if not y3 = 1 if a plant is constructed in Denver; 0 if not y4 = 1 if a plant is constructed in Kansas City; 0 if not Xij = the units shipped in thousands from plant i to distribution center j i= 1,2,3,4,5, and j = 1,2,3 Min X11+ X12 + X13 + X21 + X22+ X23 + X31 + X32 + X33 + X41+ X42 + X43 + X51+ X52 + X53+ Y2 + y3 + y4 + Min X11+ X12+ X13 + X21 + X22 + X23+ X31 + X32+ X33 + X41+ X42 X43 + X51+ X52 + X53 + yi + y2 y3 y4 s.t. X11 + X12 + X13 + y1 X21 + X22 X23 + y2 X31 X32 X33 y3 y4 X41 + X42 + X43 X51 + X52 + X53 X11 X21 +1 X31 + X41 + X51 X12 + X22 X42 X52 + X32 + + X13 X23 X33 + X43 X53 Xij 2 for all i i and j; y1 , Y2 , УЗ , Y1 + y2 + + + b. Formulate a model that could be used for choosing the best plant locations and for determining how much to ship from each plant to each distribution center. There is a policy restriction that no more than two plants can be located in Denver, Kansas City, and St. Louis. For those boxes in which you must enter subtractive or negative numbers use a minus sign. (Example: -300) Let yi = 1 if a plant is constructed in Detroit; 0 if not y2 = 1 if a plant is constructed in Toledo; 0 if not y3 = 1 if a plant is constructed in Denver; 0 if not y4 = 1 if a plant is constructed in Kansas City; 0 if not Xij the units shipped in thousands from plant i to distribution center j %3D i= 1,2,3,4,5, and j = 1,2,3 Min X11+ X12 + X13 + X21+ X22+ X23 + X31 + X32 + X33 + X41 + X42 X43 + X51+ X52 + X53 + y1 y2 y3 + Numeric field + + y4 s.t. X11 X12 X13 + X21 X22 X23 + y2 X31 + X32 X33 y3 X41 X42 +1 X43 y4 X51 + X52 + X53 X11 X21 X31 X41 X51 X12 + X22 X32 X42 X52 X13 + X23 X33 X43 X53 Xij 2 for all i and j; y1 , Y2 , Уз , Уз + у4 + + + + + + + + + + + + The Martin-Beck Company operates a plant in St. Louis with an annual capacity of 30,000 units. Product is shipped to regional distribution centers located in Boston, Atlanta, and Houston. Because of an anticipated increase in demand, Martin- Beck plans to increase capacity by constructing a new plant in one or more of the following cities: Detroit, Toledo, Denver, or Kansas City. The estimated annual fixed cost and the annual capacity for the four proposed plants are as follows: Proposed Plant Annual Fixed Cost Annual Capacity Detroit $175,000 10,000 Toledo $300,000 20,000 Denver $375,000 30,000 Kansas City $500,000 40,000 The company's long-range planning group developed forecasts of the anticipated annual demand at the distribution centers as follows: Distribution Center Annual Demand Boston 30,000 Atlanta 20,000 Houston 20,000 The shipping cost per unit from each plant to each distribution center is shown in table below. SHIPPING COST PER UNIT FOR THE MARTIN-BECK SUPPLY CHAIN Distribution Centers ETTT Plant Site Boston Atlanta Houston Detroit 2 3 Toledo Denver 4 3 7 4 5 Kansas City St. Louis 10 8. 4 4 2 3 A network representation of the potential Martin-Beck supply chain is shown in figure below. THE NETWORK REPRESENTATION OF THE MARTIN-BECK COMPANY SUPPLY CHAIN DESIGN PROBLEM 10 Detroit Distribution Centers 30 Boston 4 20 Toledo 3. 4 9 7 30 Denver 5 Atlanta 20 10 4. 40 Kansas City 8. Houston 20 3. 30 St. Louis Сараcities Distribution Routes Demands - Each potential plant location is shown; capacities and demands are shown in thousands of units. This network representation is for a transportation problem with a plant at St. Louis and at all four proposed sites. However, the decision has not yet been made as to which new plant or plants will be constructed. a. Formulate a model that could be used for choosing the best plant locations and for determining how much to ship from each plant to each distribution center. There is a policy restriction that a plant must be located either in Detroit or in Toledo, but not both. For those boxes in which you must enter subtractive or negative numbers use a minus sign. (Example: -300) Let y1 = 1 if a plant is constructed in Detroit; 0 if not y2 = 1 if a plant is constructed in Toledo; 0 if not y3 = 1 if a plant is constructed in Denver; 0 if not y4 = 1 if a plant is constructed in Kansas City; 0 if not Xij = the units shipped in thousands from plant i to distribution center j i= 1,2,3,4,5, and j = 1,2,3 Min X11+ X12 + X13 + X21 + X22+ X23 + X31 + X32 + X33 + X41+ X42 + X43 + X51+ X52 + X53+ Y2 + y3 + y4 + Min X11+ X12+ X13 + X21 + X22 + X23+ X31 + X32+ X33 + X41+ X42 X43 + X51+ X52 + X53 + yi + y2 y3 y4 s.t. X11 + X12 + X13 + y1 X21 + X22 X23 + y2 X31 X32 X33 y3 y4 X41 + X42 + X43 X51 + X52 + X53 X11 X21 +1 X31 + X41 + X51 X12 + X22 X42 X52 + X32 + + X13 X23 X33 + X43 X53 Xij 2 for all i i and j; y1 , Y2 , УЗ , Y1 + y2 + + + b. Formulate a model that could be used for choosing the best plant locations and for determining how much to ship from each plant to each distribution center. There is a policy restriction that no more than two plants can be located in Denver, Kansas City, and St. Louis. For those boxes in which you must enter subtractive or negative numbers use a minus sign. (Example: -300) Let yi = 1 if a plant is constructed in Detroit; 0 if not y2 = 1 if a plant is constructed in Toledo; 0 if not y3 = 1 if a plant is constructed in Denver; 0 if not y4 = 1 if a plant is constructed in Kansas City; 0 if not Xij the units shipped in thousands from plant i to distribution center j %3D i= 1,2,3,4,5, and j = 1,2,3 Min X11+ X12 + X13 + X21+ X22+ X23 + X31 + X32 + X33 + X41 + X42 X43 + X51+ X52 + X53 + y1 y2 y3 + Numeric field + + y4 s.t. X11 X12 X13 + X21 X22 X23 + y2 X31 + X32 X33 y3 X41 X42 +1 X43 y4 X51 + X52 + X53 X11 X21 X31 X41 X51 X12 + X22 X32 X42 X52 X13 + X23 X33 X43 X53 Xij 2 for all i and j; y1 , Y2 , Уз , Уз + у4 + + + + + + + + + + + + The Martin-Beck Company operates a plant in St. Louis with an annual capacity of 30,000 units. Product is shipped to regional distribution centers located in Boston, Atlanta, and Houston. Because of an anticipated increase in demand, Martin- Beck plans to increase capacity by constructing a new plant in one or more of the following cities: Detroit, Toledo, Denver, or Kansas City. The estimated annual fixed cost and the annual capacity for the four proposed plants are as follows: Proposed Plant Annual Fixed Cost Annual Capacity Detroit $175,000 10,000 Toledo $300,000 20,000 Denver $375,000 30,000 Kansas City $500,000 40,000 The company's long-range planning group developed forecasts of the anticipated annual demand at the distribution centers as follows: Distribution Center Annual Demand Boston 30,000 Atlanta 20,000 Houston 20,000 The shipping cost per unit from each plant to each distribution center is shown in table below. SHIPPING COST PER UNIT FOR THE MARTIN-BECK SUPPLY CHAIN Distribution Centers ETTT Plant Site Boston Atlanta Houston Detroit 2 3 Toledo Denver 4 3 7 4 5 Kansas City St. Louis 10 8. 4 4 2 3 A network representation of the potential Martin-Beck supply chain is shown in figure below. THE NETWORK REPRESENTATION OF THE MARTIN-BECK COMPANY SUPPLY CHAIN DESIGN PROBLEM 10 Detroit Distribution Centers 30 Boston 4 20 Toledo 3. 4 9 7 30 Denver 5 Atlanta 20 10 4. 40 Kansas City 8. Houston 20 3. 30 St. Louis Сараcities Distribution Routes Demands - Each potential plant location is shown; capacities and demands are shown in thousands of units. This network representation is for a transportation problem with a plant at St. Louis and at all four proposed sites. However, the decision has not yet been made as to which new plant or plants will be constructed. a. Formulate a model that could be used for choosing the best plant locations and for determining how much to ship from each plant to each distribution center. There is a policy restriction that a plant must be located either in Detroit or in Toledo, but not both. For those boxes in which you must enter subtractive or negative numbers use a minus sign. (Example: -300) Let y1 = 1 if a plant is constructed in Detroit; 0 if not y2 = 1 if a plant is constructed in Toledo; 0 if not y3 = 1 if a plant is constructed in Denver; 0 if not y4 = 1 if a plant is constructed in Kansas City; 0 if not Xij = the units shipped in thousands from plant i to distribution center j i= 1,2,3,4,5, and j = 1,2,3 Min X11+ X12 + X13 + X21 + X22+ X23 + X31 + X32 + X33 + X41+ X42 + X43 + X51+ X52 + X53+ Y2 + y3 + y4 + Min X11+ X12+ X13 + X21 + X22 + X23+ X31 + X32+ X33 + X41+ X42 X43 + X51+ X52 + X53 + yi + y2 y3 y4 s.t. X11 + X12 + X13 + y1 X21 + X22 X23 + y2 X31 X32 X33 y3 y4 X41 + X42 + X43 X51 + X52 + X53 X11 X21 +1 X31 + X41 + X51 X12 + X22 X42 X52 + X32 + + X13 X23 X33 + X43 X53 Xij 2 for all i i and j; y1 , Y2 , УЗ , Y1 + y2 + + + b. Formulate a model that could be used for choosing the best plant locations and for determining how much to ship from each plant to each distribution center. There is a policy restriction that no more than two plants can be located in Denver, Kansas City, and St. Louis. For those boxes in which you must enter subtractive or negative numbers use a minus sign. (Example: -300) Let yi = 1 if a plant is constructed in Detroit; 0 if not y2 = 1 if a plant is constructed in Toledo; 0 if not y3 = 1 if a plant is constructed in Denver; 0 if not y4 = 1 if a plant is constructed in Kansas City; 0 if not Xij the units shipped in thousands from plant i to distribution center j %3D i= 1,2,3,4,5, and j = 1,2,3 Min X11+ X12 + X13 + X21+ X22+ X23 + X31 + X32 + X33 + X41 + X42 X43 + X51+ X52 + X53 + y1 y2 y3 + Numeric field + + y4 s.t. X11 X12 X13 + X21 X22 X23 + y2 X31 + X32 X33 y3 X41 X42 +1 X43 y4 X51 + X52 + X53 X11 X21 X31 X41 X51 X12 + X22 X32 X42 X52 X13 + X23 X33 X43 X53 Xij 2 for all i and j; y1 , Y2 , Уз , Уз + у4 + + + + + + + + + + + + The Martin-Beck Company operates a plant in St. Louis with an annual capacity of 30,000 units. Product is shipped to regional distribution centers located in Boston, Atlanta, and Houston. Because of an anticipated increase in demand, Martin- Beck plans to increase capacity by constructing a new plant in one or more of the following cities: Detroit, Toledo, Denver, or Kansas City. The estimated annual fixed cost and the annual capacity for the four proposed plants are as follows: Proposed Plant Annual Fixed Cost Annual Capacity Detroit $175,000 10,000 Toledo $300,000 20,000 Denver $375,000 30,000 Kansas City $500,000 40,000 The company's long-range planning group developed forecasts of the anticipated annual demand at the distribution centers as follows: Distribution Center Annual Demand Boston 30,000 Atlanta 20,000 Houston 20,000 The shipping cost per unit from each plant to each distribution center is shown in table below. SHIPPING COST PER UNIT FOR THE MARTIN-BECK SUPPLY CHAIN Distribution Centers ETTT Plant Site Boston Atlanta Houston Detroit 2 3 Toledo Denver 4 3 7 4 5 Kansas City St. Louis 10 8. 4 4 2 3 A network representation of the potential Martin-Beck supply chain is shown in figure below. THE NETWORK REPRESENTATION OF THE MARTIN-BECK COMPANY SUPPLY CHAIN DESIGN PROBLEM 10 Detroit Distribution Centers 30 Boston 4 20 Toledo 3. 4 9 7 30 Denver 5 Atlanta 20 10 4. 40 Kansas City 8. Houston 20 3. 30 St. Louis Сараcities Distribution Routes Demands - Each potential plant location is shown; capacities and demands are shown in thousands of units. This network representation is for a transportation problem with a plant at St. Louis and at all four proposed sites. However, the decision has not yet been made as to which new plant or plants will be constructed. a. Formulate a model that could be used for choosing the best plant locations and for determining how much to ship from each plant to each distribution center. There is a policy restriction that a plant must be located either in Detroit or in Toledo, but not both. For those boxes in which you must enter subtractive or negative numbers use a minus sign. (Example: -300) Let y1 = 1 if a plant is constructed in Detroit; 0 if not y2 = 1 if a plant is constructed in Toledo; 0 if not y3 = 1 if a plant is constructed in Denver; 0 if not y4 = 1 if a plant is constructed in Kansas City; 0 if not Xij = the units shipped in thousands from plant i to distribution center j i= 1,2,3,4,5, and j = 1,2,3 Min X11+ X12 + X13 + X21 + X22+ X23 + X31 + X32 + X33 + X41+ X42 + X43 + X51+ X52 + X53+ Y2 + y3 + y4 + Min X11+ X12+ X13 + X21 + X22 + X23+ X31 + X32+ X33 + X41+ X42 X43 + X51+ X52 + X53 + yi + y2 y3 y4 s.t. X11 + X12 + X13 + y1 X21 + X22 X23 + y2 X31 X32 X33 y3 y4 X41 + X42 + X43 X51 + X52 + X53 X11 X21 +1 X31 + X41 + X51 X12 + X22 X42 X52 + X32 + + X13 X23 X33 + X43 X53 Xij 2 for all i i and j; y1 , Y2 , УЗ , Y1 + y2 + + + b. Formulate a model that could be used for choosing the best plant locations and for determining how much to ship from each plant to each distribution center. There is a policy restriction that no more than two plants can be located in Denver, Kansas City, and St. Louis. For those boxes in which you must enter subtractive or negative numbers use a minus sign. (Example: -300) Let yi = 1 if a plant is constructed in Detroit; 0 if not y2 = 1 if a plant is constructed in Toledo; 0 if not y3 = 1 if a plant is constructed in Denver; 0 if not y4 = 1 if a plant is constructed in Kansas City; 0 if not Xij the units shipped in thousands from plant i to distribution center j %3D i= 1,2,3,4,5, and j = 1,2,3 Min X11+ X12 + X13 + X21+ X22+ X23 + X31 + X32 + X33 + X41 + X42 X43 + X51+ X52 + X53 + y1 y2 y3 + Numeric field + + y4 s.t. X11 X12 X13 + X21 X22 X23 + y2 X31 + X32 X33 y3 X41 X42 +1 X43 y4 X51 + X52 + X53 X11 X21 X31 X41 X51 X12 + X22 X32 X42 X52 X13 + X23 X33 X43 X53 Xij 2 for all i and j; y1 , Y2 , Уз , Уз + у4 + + + + + + + + + + + + The Martin-Beck Company operates a plant in St. Louis with an annual capacity of 30,000 units. Product is shipped to regional distribution centers located in Boston, Atlanta, and Houston. Because of an anticipated increase in demand, Martin- Beck plans to increase capacity by constructing a new plant in one or more of the following cities: Detroit, Toledo, Denver, or Kansas City. The estimated annual fixed cost and the annual capacity for the four proposed plants are as follows: Proposed Plant Annual Fixed Cost Annual Capacity Detroit $175,000 10,000 Toledo $300,000 20,000 Denver $375,000 30,000 Kansas City $500,000 40,000 The company's long-range planning group developed forecasts of the anticipated annual demand at the distribution centers as follows: Distribution Center Annual Demand Boston 30,000 Atlanta 20,000 Houston 20,000 The shipping cost per unit from each plant to each distribution center is shown in table below. SHIPPING COST PER UNIT FOR THE MARTIN-BECK SUPPLY CHAIN Distribution Centers ETTT Plant Site Boston Atlanta Houston Detroit 2 3 Toledo Denver 4 3 7 4 5 Kansas City St. Louis 10 8. 4 4 2 3 A network representation of the potential Martin-Beck supply chain is shown in figure below. THE NETWORK REPRESENTATION OF THE MARTIN-BECK COMPANY SUPPLY CHAIN DESIGN PROBLEM 10 Detroit Distribution Centers 30 Boston 4 20 Toledo 3. 4 9 7 30 Denver 5 Atlanta 20 10 4. 40 Kansas City 8. Houston 20 3. 30 St. Louis Сараcities Distribution Routes Demands - Each potential plant location is shown; capacities and demands are shown in thousands of units. This network representation is for a transportation problem with a plant at St. Louis and at all four proposed sites. However, the decision has not yet been made as to which new plant or plants will be constructed. a. Formulate a model that could be used for choosing the best plant locations and for determining how much to ship from each plant to each distribution center. There is a policy restriction that a plant must be located either in Detroit or in Toledo, but not both. For those boxes in which you must enter subtractive or negative numbers use a minus sign. (Example: -300) Let y1 = 1 if a plant is constructed in Detroit; 0 if not y2 = 1 if a plant is constructed in Toledo; 0 if not y3 = 1 if a plant is constructed in Denver; 0 if not y4 = 1 if a plant is constructed in Kansas City; 0 if not Xij = the units shipped in thousands from plant i to distribution center j i= 1,2,3,4,5, and j = 1,2,3 Min X11+ X12 + X13 + X21 + X22+ X23 + X31 + X32 + X33 + X41+ X42 + X43 + X51+ X52 + X53+ Y2 + y3 + y4 + Min X11+ X12+ X13 + X21 + X22 + X23+ X31 + X32+ X33 + X41+ X42 X43 + X51+ X52 + X53 + yi + y2 y3 y4 s.t. X11 + X12 + X13 + y1 X21 + X22 X23 + y2 X31 X32 X33 y3 y4 X41 + X42 + X43 X51 + X52 + X53 X11 X21 +1 X31 + X41 + X51 X12 + X22 X42 X52 + X32 + + X13 X23 X33 + X43 X53 Xij 2 for all i i and j; y1 , Y2 , УЗ , Y1 + y2 + + + b. Formulate a model that could be used for choosing the best plant locations and for determining how much to ship from each plant to each distribution center. There is a policy restriction that no more than two plants can be located in Denver, Kansas City, and St. Louis. For those boxes in which you must enter subtractive or negative numbers use a minus sign. (Example: -300) Let yi = 1 if a plant is constructed in Detroit; 0 if not y2 = 1 if a plant is constructed in Toledo; 0 if not y3 = 1 if a plant is constructed in Denver; 0 if not y4 = 1 if a plant is constructed in Kansas City; 0 if not Xij the units shipped in thousands from plant i to distribution center j %3D i= 1,2,3,4,5, and j = 1,2,3 Min X11+ X12 + X13 + X21+ X22+ X23 + X31 + X32 + X33 + X41 + X42 X43 + X51+ X52 + X53 + y1 y2 y3 + Numeric field + + y4 s.t. X11 X12 X13 + X21 X22 X23 + y2 X31 + X32 X33 y3 X41 X42 +1 X43 y4 X51 + X52 + X53 X11 X21 X31 X41 X51 X12 + X22 X32 X42 X52 X13 + X23 X33 X43 X53 Xij 2 for all i and j; y1 , Y2 , Уз , Уз + у4 + + + + + + + + + + + + The Martin-Beck Company operates a plant in St. Louis with an annual capacity of 30,000 units. Product is shipped to regional distribution centers located in Boston, Atlanta, and Houston. Because of an anticipated increase in demand, Martin- Beck plans to increase capacity by constructing a new plant in one or more of the following cities: Detroit, Toledo, Denver, or Kansas City. The estimated annual fixed cost and the annual capacity for the four proposed plants are as follows: Proposed Plant Annual Fixed Cost Annual Capacity Detroit $175,000 10,000 Toledo $300,000 20,000 Denver $375,000 30,000 Kansas City $500,000 40,000 The company's long-range planning group developed forecasts of the anticipated annual demand at the distribution centers as follows: Distribution Center Annual Demand Boston 30,000 Atlanta 20,000 Houston 20,000 The shipping cost per unit from each plant to each distribution center is shown in table below. SHIPPING COST PER UNIT FOR THE MARTIN-BECK SUPPLY CHAIN Distribution Centers ETTT Plant Site Boston Atlanta Houston Detroit 2 3 Toledo Denver 4 3 7 4 5 Kansas City St. Louis 10 8. 4 4 2 3 A network representation of the potential Martin-Beck supply chain is shown in figure below. THE NETWORK REPRESENTATION OF THE MARTIN-BECK COMPANY SUPPLY CHAIN DESIGN PROBLEM 10 Detroit Distribution Centers 30 Boston 4 20 Toledo 3. 4 9 7 30 Denver 5 Atlanta 20 10 4. 40 Kansas City 8. Houston 20 3. 30 St. Louis Сараcities Distribution Routes Demands - Each potential plant location is shown; capacities and demands are shown in thousands of units. This network representation is for a transportation problem with a plant at St. Louis and at all four proposed sites. However, the decision has not yet been made as to which new plant or plants will be constructed. a. Formulate a model that could be used for choosing the best plant locations and for determining how much to ship from each plant to each distribution center. There is a policy restriction that a plant must be located either in Detroit or in Toledo, but not both. For those boxes in which you must enter subtractive or negative numbers use a minus sign. (Example: -300) Let y1 = 1 if a plant is constructed in Detroit; 0 if not y2 = 1 if a plant is constructed in Toledo; 0 if not y3 = 1 if a plant is constructed in Denver; 0 if not y4 = 1 if a plant is constructed in Kansas City; 0 if not Xij = the units shipped in thousands from plant i to distribution center j i= 1,2,3,4,5, and j = 1,2,3 Min X11+ X12 + X13 + X21 + X22+ X23 + X31 + X32 + X33 + X41+ X42 + X43 + X51+ X52 + X53+ Y2 + y3 + y4 + Min X11+ X12+ X13 + X21 + X22 + X23+ X31 + X32+ X33 + X41+ X42 X43 + X51+ X52 + X53 + yi + y2 y3 y4 s.t. X11 + X12 + X13 + y1 X21 + X22 X23 + y2 X31 X32 X33 y3 y4 X41 + X42 + X43 X51 + X52 + X53 X11 X21 +1 X31 + X41 + X51 X12 + X22 X42 X52 + X32 + + X13 X23 X33 + X43 X53 Xij 2 for all i i and j; y1 , Y2 , УЗ , Y1 + y2 + + + b. Formulate a model that could be used for choosing the best plant locations and for determining how much to ship from each plant to each distribution center. There is a policy restriction that no more than two plants can be located in Denver, Kansas City, and St. Louis. For those boxes in which you must enter subtractive or negative numbers use a minus sign. (Example: -300) Let yi = 1 if a plant is constructed in Detroit; 0 if not y2 = 1 if a plant is constructed in Toledo; 0 if not y3 = 1 if a plant is constructed in Denver; 0 if not y4 = 1 if a plant is constructed in Kansas City; 0 if not Xij the units shipped in thousands from plant i to distribution center j %3D i= 1,2,3,4,5, and j = 1,2,3 Min X11+ X12 + X13 + X21+ X22+ X23 + X31 + X32 + X33 + X41 + X42 X43 + X51+ X52 + X53 + y1 y2 y3 + Numeric field + + y4 s.t. X11 X12 X13 + X21 X22 X23 + y2 X31 + X32 X33 y3 X41 X42 +1 X43 y4 X51 + X52 + X53 X11 X21 X31 X41 X51 X12 + X22 X32 X42 X52 X13 + X23 X33 X43 X53 Xij 2 for all i and j; y1 , Y2 , Уз , Уз + у4 + + + + + + + + + + + +
Expert Answer:
Answer rating: 100% (QA)
The shipping cost per unit from each plant to each distribution center is as fol... View the full answer

Related Book For 
Quantitative Methods for Business
ISBN: 978-0840062345
12th edition
Authors: David Anderson, Dennis Sweeney, Thomas Williams, Jeffrey Cam
Posted Date:
Students also viewed these accounting questions
-
This visualization is an example of which type of data visualization? how scientific accounting Selected Answer: Answers: A boxplot A histogram A boxplot A A bar graph A stacked bar chart A line...
-
Galaxy Cloud Services operates several data centers across the United States that contain servers which store and process the data on the Internet. Suppose that Galaxy Cloud Services currently has...
-
Consider the following population growth model N t =N 0 * t Question options: It includes the "finite rate of increase" It includes the "intrinsic rate of increase" It includes the "Malthusian...
-
Apply the product rule for exponents, if possible. y 4 y 5 y 6
-
Revise these sentences in order to present the ideas in parallel form: a. Mr. Hill is expected to lecture three days a week, to counsel two days a week, and must write for publication in his spare...
-
The angular momentum vector of a particle of mass m is written as \(\mathbf{L}=\mathbf{r} \times \mathbf{p}\). Find the Poisson brackets of any two components of the angular momentum vector in...
-
The type of model building used by Pauling and by Watson and Crick involved the use of ball-and-stick units. Model building can now be done with computer software. Even though you may not be familiar...
-
Paula Shoemaker produces a weekly stock market report for an exclusive readership. She normally sells 3,000 reports per week, and 70% of the time her sales range from 2,900 to 3,100. The report costs...
-
Fine Equipment uses a perpetual inventory system and is located in Vancouver, British Columbia, where the PST rate is 7 % . Fine Equipment uses the earnings approach for revenue recognition. The...
-
Obtain the Laplace transform of f (t) in Fig. 15.28 . f(t) A 15 1 2 3 4 t
-
In this part of the lab the board is inclined at an angle by raising the end closest to the pulley. Your teacher will determine the following Height of ramp = _ Angle of ramp = Hanging mass =...
-
Jenny and Leroy (married filing jointly) both have retirement plans at work. Their combined total income is $90,000. If Jenny contributes $6,000 to an IRA and Leroy contributes $5,000 to a Roth IRA,...
-
A company is considering whether to invest in a customer acquisition initiative costing $2 million which is expected to yield a gross margin of $2.4 million. After investing $1 million, the company...
-
Create a driver that will create an ArrayList of Accounts from the file have a method to create the ArrayList have a method to display all items in the ArrayList have a method to search the ArrayList...
-
Total cost per unit 138 The desired ROl per 41.4 Target selling price is 179.4 Assume the new product requires an investment of $20,000,000 to be manufactured, and the company wants to achieve ROl of...
-
Write method named isValid which receives one parameter of type double representing a number of hours, and returns true if the number of hours is valid (between 0 and 168 inclusive), false otherwise....
-
a) Outline the reasons divergence in international accounting practices b) Is it realistic to expert complete standardization of international accounting practices?is standardization desirable?...
-
Suppose Green Network Energy needs to raise money to finance its new manufacturing facility, but their CFO does not think the company is financially capable of making the periodic interest payments...
-
A company imports goods at two ports: Philadelphia and New Orleans. Shipments of one product are made to customers in Atlanta, Dallas, Columbus, and Boston. For the next planning period, the supplies...
-
Consider the following mixed-integer linear program: Max 1x1 + 1x2 s.t. 7x1 + 9x2 63 9x1 + 5x2 45 3x1 + 1x2 12 x1, x2 0 and x2 integer a. Graph the constraints for this problem. Indicate on your...
-
The purpose of this exercise is to provide practice using LINGO or Excel Solver. Find the values of X and Y that minimize the function Min X2 - 4X + Y2 + 8Y + 20 Do not assume non-negativity of the X...
-
Two blocks of equal mass \(m\), connected by a Hooke's-law spring of unstretched length \(\ell\), are free to move in one dimension. Find the equations of motion of the system, using the relative and...
-
In certain situations, it is possible to incorporate frictional effects in a simple way into a Lagrangian problem. As an example, consider the Lagrangian (a) Find the equation of motion for the...
-
Consider a vertical circular hoop of radius \(R\) rotating about its vertical symmetry axis with constant angular velocity \(\Omega\). A bead of mass \(m\) is threaded onto the hoop, so is free to...

Study smarter with the SolutionInn App