

Brock's administration is thinking about implementing a policy of coed floors only in dormitories. Currently there...
Fantastic news! We've Found the answer you've been seeking!
Question:
Transcribed Image Text:
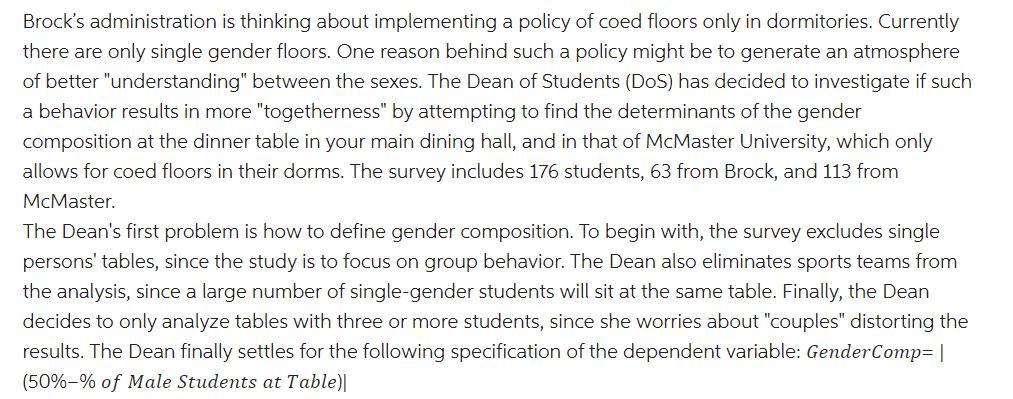
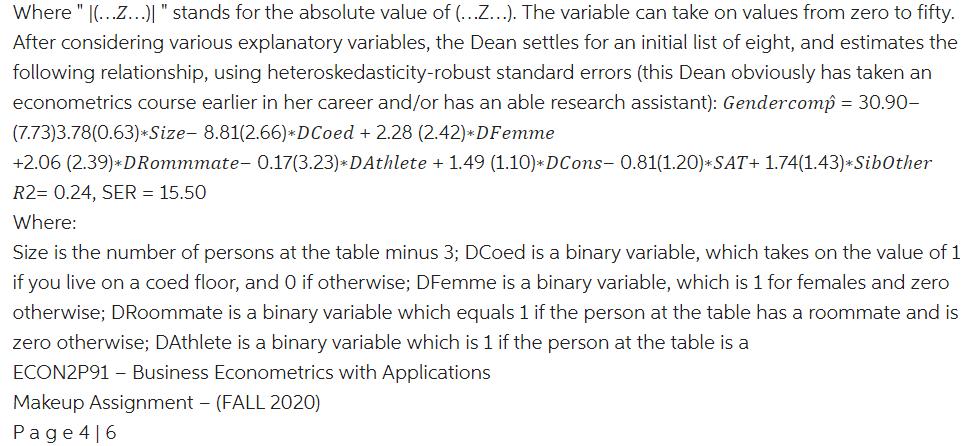
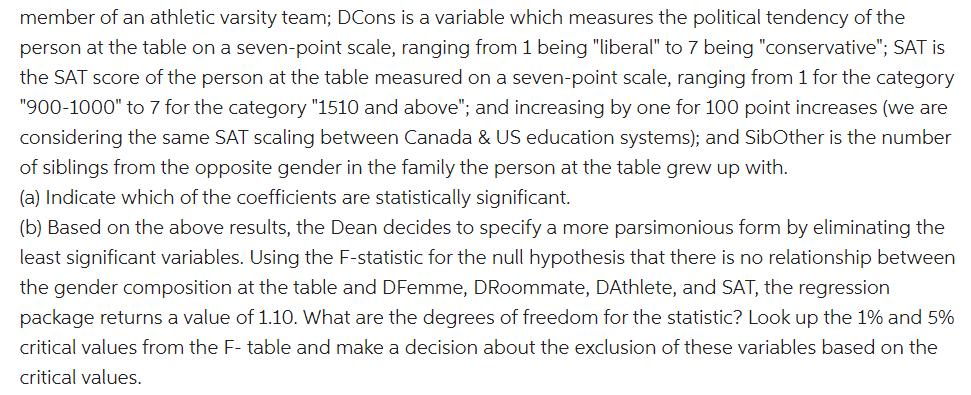
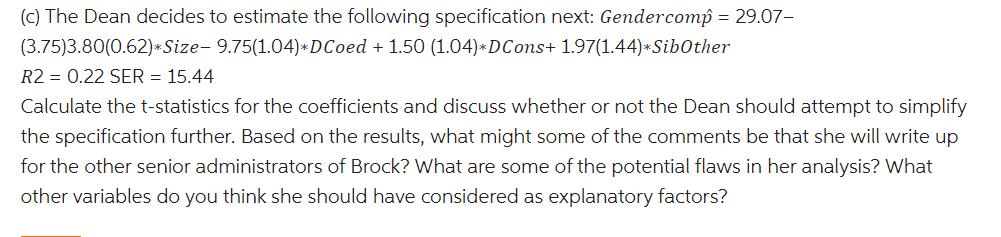
Brock's administration is thinking about implementing a policy of coed floors only in dormitories. Currently there are only single gender floors. One reason behind such a policy might be to generate an atmosphere of better "understanding" between the sexes. The Dean of Students (DoS) has decided to investigate if such a behavior results in more "togetherness" by attempting to find the determinants of the gender composition at the dinner table in your main dining hall, and in that of McMaster University, which only allows for coed floors in their dorms. The survey includes 176 students, 63 from Brock, and 113 from McMaster. The Dean's first problem is how to define gender composition. To begin with, the survey excludes single persons' tables, since the study is to focus on group behavior. The Dean also eliminates sports teams from the analysis, since a large number of single-gender students will sit at the same table. Finally, the Dean decides to only analyze tables with three or more students, since she worries about "couples" distorting the results. The Dean finally settles for the following specification of the dependent variable: GenderComp= | (50%-% of Male Students at Table)| Where " |(...z...)| " stands for the absolute value of (...Z...). The variable can take on values from zero to fifty. After considering various explanatory variables, the Dean settles for an initial list of eight, and estimates the following relationship, using heteroskedasticity-robust standard errors (this Dean obviously has taken an econometrics course earlier in her career and/or has an able research assistant): Gendercomp = 30.90- (7.73)3.78(0.63)*Size- 8.81(2.66)*DCoed + 2.28 (2.42)*DFemme +2.06 (2.39)*DRommmate- 0.17(3.23)*DAthlete + 1.49 (1.10)* DCons- 0.81(1.20)*SAT+ 1.74(1.43)*SibOther R2= 0.24, SER = 15.50 Where: Size is the number of persons at the table minus 3; DCoed is a binary variable, which takes on the value of 1 if you live on a coed floor, and 0 if otherwise; DFemme is a binary variable, which is 1 for females and zero otherwise; DRoommate is a binary variable which equals 1 if the person at the table has a roommate and is zero otherwise; DAthlete is a binary variable which is 1 if the person at the table is a ECON2P91 - Business Econometrics with Applications Makeup Assignment - (FALL 2020) Page 4|6 member of an athletic varsity team; DCons is a variable which measures the political tendency of the person at the table on a seven-point scale, ranging from 1 being "liberal" to 7 being "conservative"; SAT is the SAT score of the person at the table measured on a seven-point scale, ranging from 1 for the category "900-1000" to 7 for the category "1510 and above"; and increasing by one for 100 point increases (we are considering the same SAT scaling between Canada & US education systems); and SibOther is the number of siblings from the opposite gender in the family the person at the table grew up with. (a) Indicate which of the coefficients are statistically significant. (b) Based on the above results, the Dean decides to specify a more parsimonious form by eliminating the least significant variables. Using the F-statistic for the null hypothesis that there is no relationship between the gender composition at the table and DFemme, DRoommate, DAthlete, and SAT, the regression package returns a value of 1.10. What are the degrees of freedom for the statistic? Look up the 1% and 5% critical values from the F- table and make a decision about the exclusion of these variables based on the critical values. (c) The Dean decides to estimate the following specification next: Gendercomp = 29.07- (3.75)3.80(0.62)*Size- 9.75(1.04)*DCoed + 1.50 (1.04)*DCons+ 1.97(1.44)*SibOther R2 = 0.22 SER = 15.44 Calculate the t-statistics for the coefficients and discuss whether or not the Dean should attempt to simplify the specification further. Based on the results, what might some of the comments be that she will write up for the other senior administrators of Brock? What are some of the potential flaws in her analysis? What other variables do you think she should have considered as explanatory factors? Brock's administration is thinking about implementing a policy of coed floors only in dormitories. Currently there are only single gender floors. One reason behind such a policy might be to generate an atmosphere of better "understanding" between the sexes. The Dean of Students (DoS) has decided to investigate if such a behavior results in more "togetherness" by attempting to find the determinants of the gender composition at the dinner table in your main dining hall, and in that of McMaster University, which only allows for coed floors in their dorms. The survey includes 176 students, 63 from Brock, and 113 from McMaster. The Dean's first problem is how to define gender composition. To begin with, the survey excludes single persons' tables, since the study is to focus on group behavior. The Dean also eliminates sports teams from the analysis, since a large number of single-gender students will sit at the same table. Finally, the Dean decides to only analyze tables with three or more students, since she worries about "couples" distorting the results. The Dean finally settles for the following specification of the dependent variable: GenderComp= | (50%-% of Male Students at Table)| Where " |(...z...)| " stands for the absolute value of (...Z...). The variable can take on values from zero to fifty. After considering various explanatory variables, the Dean settles for an initial list of eight, and estimates the following relationship, using heteroskedasticity-robust standard errors (this Dean obviously has taken an econometrics course earlier in her career and/or has an able research assistant): Gendercomp = 30.90- (7.73)3.78(0.63)*Size- 8.81(2.66)*DCoed + 2.28 (2.42)*DFemme +2.06 (2.39)*DRommmate- 0.17(3.23)*DAthlete + 1.49 (1.10)* DCons- 0.81(1.20)*SAT+ 1.74(1.43)*SibOther R2= 0.24, SER = 15.50 Where: Size is the number of persons at the table minus 3; DCoed is a binary variable, which takes on the value of 1 if you live on a coed floor, and 0 if otherwise; DFemme is a binary variable, which is 1 for females and zero otherwise; DRoommate is a binary variable which equals 1 if the person at the table has a roommate and is zero otherwise; DAthlete is a binary variable which is 1 if the person at the table is a ECON2P91 - Business Econometrics with Applications Makeup Assignment - (FALL 2020) Page 4|6 member of an athletic varsity team; DCons is a variable which measures the political tendency of the person at the table on a seven-point scale, ranging from 1 being "liberal" to 7 being "conservative"; SAT is the SAT score of the person at the table measured on a seven-point scale, ranging from 1 for the category "900-1000" to 7 for the category "1510 and above"; and increasing by one for 100 point increases (we are considering the same SAT scaling between Canada & US education systems); and SibOther is the number of siblings from the opposite gender in the family the person at the table grew up with. (a) Indicate which of the coefficients are statistically significant. (b) Based on the above results, the Dean decides to specify a more parsimonious form by eliminating the least significant variables. Using the F-statistic for the null hypothesis that there is no relationship between the gender composition at the table and DFemme, DRoommate, DAthlete, and SAT, the regression package returns a value of 1.10. What are the degrees of freedom for the statistic? Look up the 1% and 5% critical values from the F- table and make a decision about the exclusion of these variables based on the critical values. (c) The Dean decides to estimate the following specification next: Gendercomp = 29.07- (3.75)3.80(0.62)*Size- 9.75(1.04)*DCoed + 1.50 (1.04)*DCons+ 1.97(1.44)*SibOther R2 = 0.22 SER = 15.44 Calculate the t-statistics for the coefficients and discuss whether or not the Dean should attempt to simplify the specification further. Based on the results, what might some of the comments be that she will write up for the other senior administrators of Brock? What are some of the potential flaws in her analysis? What other variables do you think she should have considered as explanatory factors? Brock's administration is thinking about implementing a policy of coed floors only in dormitories. Currently there are only single gender floors. One reason behind such a policy might be to generate an atmosphere of better "understanding" between the sexes. The Dean of Students (DoS) has decided to investigate if such a behavior results in more "togetherness" by attempting to find the determinants of the gender composition at the dinner table in your main dining hall, and in that of McMaster University, which only allows for coed floors in their dorms. The survey includes 176 students, 63 from Brock, and 113 from McMaster. The Dean's first problem is how to define gender composition. To begin with, the survey excludes single persons' tables, since the study is to focus on group behavior. The Dean also eliminates sports teams from the analysis, since a large number of single-gender students will sit at the same table. Finally, the Dean decides to only analyze tables with three or more students, since she worries about "couples" distorting the results. The Dean finally settles for the following specification of the dependent variable: GenderComp= | (50%-% of Male Students at Table)| Where " |(...z...)| " stands for the absolute value of (...Z...). The variable can take on values from zero to fifty. After considering various explanatory variables, the Dean settles for an initial list of eight, and estimates the following relationship, using heteroskedasticity-robust standard errors (this Dean obviously has taken an econometrics course earlier in her career and/or has an able research assistant): Gendercomp = 30.90- (7.73)3.78(0.63)*Size- 8.81(2.66)*DCoed + 2.28 (2.42)*DFemme +2.06 (2.39)*DRommmate- 0.17(3.23)*DAthlete + 1.49 (1.10)* DCons- 0.81(1.20)*SAT+ 1.74(1.43)*SibOther R2= 0.24, SER = 15.50 Where: Size is the number of persons at the table minus 3; DCoed is a binary variable, which takes on the value of 1 if you live on a coed floor, and 0 if otherwise; DFemme is a binary variable, which is 1 for females and zero otherwise; DRoommate is a binary variable which equals 1 if the person at the table has a roommate and is zero otherwise; DAthlete is a binary variable which is 1 if the person at the table is a ECON2P91 - Business Econometrics with Applications Makeup Assignment - (FALL 2020) Page 4|6 member of an athletic varsity team; DCons is a variable which measures the political tendency of the person at the table on a seven-point scale, ranging from 1 being "liberal" to 7 being "conservative"; SAT is the SAT score of the person at the table measured on a seven-point scale, ranging from 1 for the category "900-1000" to 7 for the category "1510 and above"; and increasing by one for 100 point increases (we are considering the same SAT scaling between Canada & US education systems); and SibOther is the number of siblings from the opposite gender in the family the person at the table grew up with. (a) Indicate which of the coefficients are statistically significant. (b) Based on the above results, the Dean decides to specify a more parsimonious form by eliminating the least significant variables. Using the F-statistic for the null hypothesis that there is no relationship between the gender composition at the table and DFemme, DRoommate, DAthlete, and SAT, the regression package returns a value of 1.10. What are the degrees of freedom for the statistic? Look up the 1% and 5% critical values from the F- table and make a decision about the exclusion of these variables based on the critical values. (c) The Dean decides to estimate the following specification next: Gendercomp = 29.07- (3.75)3.80(0.62)*Size- 9.75(1.04)*DCoed + 1.50 (1.04)*DCons+ 1.97(1.44)*SibOther R2 = 0.22 SER = 15.44 Calculate the t-statistics for the coefficients and discuss whether or not the Dean should attempt to simplify the specification further. Based on the results, what might some of the comments be that she will write up for the other senior administrators of Brock? What are some of the potential flaws in her analysis? What other variables do you think she should have considered as explanatory factors? Brock's administration is thinking about implementing a policy of coed floors only in dormitories. Currently there are only single gender floors. One reason behind such a policy might be to generate an atmosphere of better "understanding" between the sexes. The Dean of Students (DoS) has decided to investigate if such a behavior results in more "togetherness" by attempting to find the determinants of the gender composition at the dinner table in your main dining hall, and in that of McMaster University, which only allows for coed floors in their dorms. The survey includes 176 students, 63 from Brock, and 113 from McMaster. The Dean's first problem is how to define gender composition. To begin with, the survey excludes single persons' tables, since the study is to focus on group behavior. The Dean also eliminates sports teams from the analysis, since a large number of single-gender students will sit at the same table. Finally, the Dean decides to only analyze tables with three or more students, since she worries about "couples" distorting the results. The Dean finally settles for the following specification of the dependent variable: GenderComp= | (50%-% of Male Students at Table)| Where " |(...z...)| " stands for the absolute value of (...Z...). The variable can take on values from zero to fifty. After considering various explanatory variables, the Dean settles for an initial list of eight, and estimates the following relationship, using heteroskedasticity-robust standard errors (this Dean obviously has taken an econometrics course earlier in her career and/or has an able research assistant): Gendercomp = 30.90- (7.73)3.78(0.63)*Size- 8.81(2.66)*DCoed + 2.28 (2.42)*DFemme +2.06 (2.39)*DRommmate- 0.17(3.23)*DAthlete + 1.49 (1.10)* DCons- 0.81(1.20)*SAT+ 1.74(1.43)*SibOther R2= 0.24, SER = 15.50 Where: Size is the number of persons at the table minus 3; DCoed is a binary variable, which takes on the value of 1 if you live on a coed floor, and 0 if otherwise; DFemme is a binary variable, which is 1 for females and zero otherwise; DRoommate is a binary variable which equals 1 if the person at the table has a roommate and is zero otherwise; DAthlete is a binary variable which is 1 if the person at the table is a ECON2P91 - Business Econometrics with Applications Makeup Assignment - (FALL 2020) Page 4|6 member of an athletic varsity team; DCons is a variable which measures the political tendency of the person at the table on a seven-point scale, ranging from 1 being "liberal" to 7 being "conservative"; SAT is the SAT score of the person at the table measured on a seven-point scale, ranging from 1 for the category "900-1000" to 7 for the category "1510 and above"; and increasing by one for 100 point increases (we are considering the same SAT scaling between Canada & US education systems); and SibOther is the number of siblings from the opposite gender in the family the person at the table grew up with. (a) Indicate which of the coefficients are statistically significant. (b) Based on the above results, the Dean decides to specify a more parsimonious form by eliminating the least significant variables. Using the F-statistic for the null hypothesis that there is no relationship between the gender composition at the table and DFemme, DRoommate, DAthlete, and SAT, the regression package returns a value of 1.10. What are the degrees of freedom for the statistic? Look up the 1% and 5% critical values from the F- table and make a decision about the exclusion of these variables based on the critical values. (c) The Dean decides to estimate the following specification next: Gendercomp = 29.07- (3.75)3.80(0.62)*Size- 9.75(1.04)*DCoed + 1.50 (1.04)*DCons+ 1.97(1.44)*SibOther R2 = 0.22 SER = 15.44 Calculate the t-statistics for the coefficients and discuss whether or not the Dean should attempt to simplify the specification further. Based on the results, what might some of the comments be that she will write up for the other senior administrators of Brock? What are some of the potential flaws in her analysis? What other variables do you think she should have considered as explanatory factors? Brock's administration is thinking about implementing a policy of coed floors only in dormitories. Currently there are only single gender floors. One reason behind such a policy might be to generate an atmosphere of better "understanding" between the sexes. The Dean of Students (DoS) has decided to investigate if such a behavior results in more "togetherness" by attempting to find the determinants of the gender composition at the dinner table in your main dining hall, and in that of McMaster University, which only allows for coed floors in their dorms. The survey includes 176 students, 63 from Brock, and 113 from McMaster. The Dean's first problem is how to define gender composition. To begin with, the survey excludes single persons' tables, since the study is to focus on group behavior. The Dean also eliminates sports teams from the analysis, since a large number of single-gender students will sit at the same table. Finally, the Dean decides to only analyze tables with three or more students, since she worries about "couples" distorting the results. The Dean finally settles for the following specification of the dependent variable: GenderComp= | (50%-% of Male Students at Table)| Where " |(...z...)| " stands for the absolute value of (...Z...). The variable can take on values from zero to fifty. After considering various explanatory variables, the Dean settles for an initial list of eight, and estimates the following relationship, using heteroskedasticity-robust standard errors (this Dean obviously has taken an econometrics course earlier in her career and/or has an able research assistant): Gendercomp = 30.90- (7.73)3.78(0.63)*Size- 8.81(2.66)*DCoed + 2.28 (2.42)*DFemme +2.06 (2.39)*DRommmate- 0.17(3.23)*DAthlete + 1.49 (1.10)* DCons- 0.81(1.20)*SAT+ 1.74(1.43)*SibOther R2= 0.24, SER = 15.50 Where: Size is the number of persons at the table minus 3; DCoed is a binary variable, which takes on the value of 1 if you live on a coed floor, and 0 if otherwise; DFemme is a binary variable, which is 1 for females and zero otherwise; DRoommate is a binary variable which equals 1 if the person at the table has a roommate and is zero otherwise; DAthlete is a binary variable which is 1 if the person at the table is a ECON2P91 - Business Econometrics with Applications Makeup Assignment - (FALL 2020) Page 4|6 member of an athletic varsity team; DCons is a variable which measures the political tendency of the person at the table on a seven-point scale, ranging from 1 being "liberal" to 7 being "conservative"; SAT is the SAT score of the person at the table measured on a seven-point scale, ranging from 1 for the category "900-1000" to 7 for the category "1510 and above"; and increasing by one for 100 point increases (we are considering the same SAT scaling between Canada & US education systems); and SibOther is the number of siblings from the opposite gender in the family the person at the table grew up with. (a) Indicate which of the coefficients are statistically significant. (b) Based on the above results, the Dean decides to specify a more parsimonious form by eliminating the least significant variables. Using the F-statistic for the null hypothesis that there is no relationship between the gender composition at the table and DFemme, DRoommate, DAthlete, and SAT, the regression package returns a value of 1.10. What are the degrees of freedom for the statistic? Look up the 1% and 5% critical values from the F- table and make a decision about the exclusion of these variables based on the critical values. (c) The Dean decides to estimate the following specification next: Gendercomp = 29.07- (3.75)3.80(0.62)*Size- 9.75(1.04)*DCoed + 1.50 (1.04)*DCons+ 1.97(1.44)*SibOther R2 = 0.22 SER = 15.44 Calculate the t-statistics for the coefficients and discuss whether or not the Dean should attempt to simplify the specification further. Based on the results, what might some of the comments be that she will write up for the other senior administrators of Brock? What are some of the potential flaws in her analysis? What other variables do you think she should have considered as explanatory factors? Brock's administration is thinking about implementing a policy of coed floors only in dormitories. Currently there are only single gender floors. One reason behind such a policy might be to generate an atmosphere of better "understanding" between the sexes. The Dean of Students (DoS) has decided to investigate if such a behavior results in more "togetherness" by attempting to find the determinants of the gender composition at the dinner table in your main dining hall, and in that of McMaster University, which only allows for coed floors in their dorms. The survey includes 176 students, 63 from Brock, and 113 from McMaster. The Dean's first problem is how to define gender composition. To begin with, the survey excludes single persons' tables, since the study is to focus on group behavior. The Dean also eliminates sports teams from the analysis, since a large number of single-gender students will sit at the same table. Finally, the Dean decides to only analyze tables with three or more students, since she worries about "couples" distorting the results. The Dean finally settles for the following specification of the dependent variable: GenderComp= | (50%-% of Male Students at Table)| Where " |(...z...)| " stands for the absolute value of (...Z...). The variable can take on values from zero to fifty. After considering various explanatory variables, the Dean settles for an initial list of eight, and estimates the following relationship, using heteroskedasticity-robust standard errors (this Dean obviously has taken an econometrics course earlier in her career and/or has an able research assistant): Gendercomp = 30.90- (7.73)3.78(0.63)*Size- 8.81(2.66)*DCoed + 2.28 (2.42)*DFemme +2.06 (2.39)*DRommmate- 0.17(3.23)*DAthlete + 1.49 (1.10)* DCons- 0.81(1.20)*SAT+ 1.74(1.43)*SibOther R2= 0.24, SER = 15.50 Where: Size is the number of persons at the table minus 3; DCoed is a binary variable, which takes on the value of 1 if you live on a coed floor, and 0 if otherwise; DFemme is a binary variable, which is 1 for females and zero otherwise; DRoommate is a binary variable which equals 1 if the person at the table has a roommate and is zero otherwise; DAthlete is a binary variable which is 1 if the person at the table is a ECON2P91 - Business Econometrics with Applications Makeup Assignment - (FALL 2020) Page 4|6 member of an athletic varsity team; DCons is a variable which measures the political tendency of the person at the table on a seven-point scale, ranging from 1 being "liberal" to 7 being "conservative"; SAT is the SAT score of the person at the table measured on a seven-point scale, ranging from 1 for the category "900-1000" to 7 for the category "1510 and above"; and increasing by one for 100 point increases (we are considering the same SAT scaling between Canada & US education systems); and SibOther is the number of siblings from the opposite gender in the family the person at the table grew up with. (a) Indicate which of the coefficients are statistically significant. (b) Based on the above results, the Dean decides to specify a more parsimonious form by eliminating the least significant variables. Using the F-statistic for the null hypothesis that there is no relationship between the gender composition at the table and DFemme, DRoommate, DAthlete, and SAT, the regression package returns a value of 1.10. What are the degrees of freedom for the statistic? Look up the 1% and 5% critical values from the F- table and make a decision about the exclusion of these variables based on the critical values. (c) The Dean decides to estimate the following specification next: Gendercomp = 29.07- (3.75)3.80(0.62)*Size- 9.75(1.04)*DCoed + 1.50 (1.04)*DCons+ 1.97(1.44)*SibOther R2 = 0.22 SER = 15.44 Calculate the t-statistics for the coefficients and discuss whether or not the Dean should attempt to simplify the specification further. Based on the results, what might some of the comments be that she will write up for the other senior administrators of Brock? What are some of the potential flaws in her analysis? What other variables do you think she should have considered as explanatory factors? Brock's administration is thinking about implementing a policy of coed floors only in dormitories. Currently there are only single gender floors. One reason behind such a policy might be to generate an atmosphere of better "understanding" between the sexes. The Dean of Students (DoS) has decided to investigate if such a behavior results in more "togetherness" by attempting to find the determinants of the gender composition at the dinner table in your main dining hall, and in that of McMaster University, which only allows for coed floors in their dorms. The survey includes 176 students, 63 from Brock, and 113 from McMaster. The Dean's first problem is how to define gender composition. To begin with, the survey excludes single persons' tables, since the study is to focus on group behavior. The Dean also eliminates sports teams from the analysis, since a large number of single-gender students will sit at the same table. Finally, the Dean decides to only analyze tables with three or more students, since she worries about "couples" distorting the results. The Dean finally settles for the following specification of the dependent variable: GenderComp= | (50%-% of Male Students at Table)| Where " |(...z...)| " stands for the absolute value of (...Z...). The variable can take on values from zero to fifty. After considering various explanatory variables, the Dean settles for an initial list of eight, and estimates the following relationship, using heteroskedasticity-robust standard errors (this Dean obviously has taken an econometrics course earlier in her career and/or has an able research assistant): Gendercomp = 30.90- (7.73)3.78(0.63)*Size- 8.81(2.66)*DCoed + 2.28 (2.42)*DFemme +2.06 (2.39)*DRommmate- 0.17(3.23)*DAthlete + 1.49 (1.10)* DCons- 0.81(1.20)*SAT+ 1.74(1.43)*SibOther R2= 0.24, SER = 15.50 Where: Size is the number of persons at the table minus 3; DCoed is a binary variable, which takes on the value of 1 if you live on a coed floor, and 0 if otherwise; DFemme is a binary variable, which is 1 for females and zero otherwise; DRoommate is a binary variable which equals 1 if the person at the table has a roommate and is zero otherwise; DAthlete is a binary variable which is 1 if the person at the table is a ECON2P91 - Business Econometrics with Applications Makeup Assignment - (FALL 2020) Page 4|6 member of an athletic varsity team; DCons is a variable which measures the political tendency of the person at the table on a seven-point scale, ranging from 1 being "liberal" to 7 being "conservative"; SAT is the SAT score of the person at the table measured on a seven-point scale, ranging from 1 for the category "900-1000" to 7 for the category "1510 and above"; and increasing by one for 100 point increases (we are considering the same SAT scaling between Canada & US education systems); and SibOther is the number of siblings from the opposite gender in the family the person at the table grew up with. (a) Indicate which of the coefficients are statistically significant. (b) Based on the above results, the Dean decides to specify a more parsimonious form by eliminating the least significant variables. Using the F-statistic for the null hypothesis that there is no relationship between the gender composition at the table and DFemme, DRoommate, DAthlete, and SAT, the regression package returns a value of 1.10. What are the degrees of freedom for the statistic? Look up the 1% and 5% critical values from the F- table and make a decision about the exclusion of these variables based on the critical values. (c) The Dean decides to estimate the following specification next: Gendercomp = 29.07- (3.75)3.80(0.62)*Size- 9.75(1.04)*DCoed + 1.50 (1.04)*DCons+ 1.97(1.44)*SibOther R2 = 0.22 SER = 15.44 Calculate the t-statistics for the coefficients and discuss whether or not the Dean should attempt to simplify the specification further. Based on the results, what might some of the comments be that she will write up for the other senior administrators of Brock? What are some of the potential flaws in her analysis? What other variables do you think she should have considered as explanatory factors? Brock's administration is thinking about implementing a policy of coed floors only in dormitories. Currently there are only single gender floors. One reason behind such a policy might be to generate an atmosphere of better "understanding" between the sexes. The Dean of Students (DoS) has decided to investigate if such a behavior results in more "togetherness" by attempting to find the determinants of the gender composition at the dinner table in your main dining hall, and in that of McMaster University, which only allows for coed floors in their dorms. The survey includes 176 students, 63 from Brock, and 113 from McMaster. The Dean's first problem is how to define gender composition. To begin with, the survey excludes single persons' tables, since the study is to focus on group behavior. The Dean also eliminates sports teams from the analysis, since a large number of single-gender students will sit at the same table. Finally, the Dean decides to only analyze tables with three or more students, since she worries about "couples" distorting the results. The Dean finally settles for the following specification of the dependent variable: GenderComp= | (50%-% of Male Students at Table)| Where " |(...z...)| " stands for the absolute value of (...Z...). The variable can take on values from zero to fifty. After considering various explanatory variables, the Dean settles for an initial list of eight, and estimates the following relationship, using heteroskedasticity-robust standard errors (this Dean obviously has taken an econometrics course earlier in her career and/or has an able research assistant): Gendercomp = 30.90- (7.73)3.78(0.63)*Size- 8.81(2.66)*DCoed + 2.28 (2.42)*DFemme +2.06 (2.39)*DRommmate- 0.17(3.23)*DAthlete + 1.49 (1.10)* DCons- 0.81(1.20)*SAT+ 1.74(1.43)*SibOther R2= 0.24, SER = 15.50 Where: Size is the number of persons at the table minus 3; DCoed is a binary variable, which takes on the value of 1 if you live on a coed floor, and 0 if otherwise; DFemme is a binary variable, which is 1 for females and zero otherwise; DRoommate is a binary variable which equals 1 if the person at the table has a roommate and is zero otherwise; DAthlete is a binary variable which is 1 if the person at the table is a ECON2P91 - Business Econometrics with Applications Makeup Assignment - (FALL 2020) Page 4|6 member of an athletic varsity team; DCons is a variable which measures the political tendency of the person at the table on a seven-point scale, ranging from 1 being "liberal" to 7 being "conservative"; SAT is the SAT score of the person at the table measured on a seven-point scale, ranging from 1 for the category "900-1000" to 7 for the category "1510 and above"; and increasing by one for 100 point increases (we are considering the same SAT scaling between Canada & US education systems); and SibOther is the number of siblings from the opposite gender in the family the person at the table grew up with. (a) Indicate which of the coefficients are statistically significant. (b) Based on the above results, the Dean decides to specify a more parsimonious form by eliminating the least significant variables. Using the F-statistic for the null hypothesis that there is no relationship between the gender composition at the table and DFemme, DRoommate, DAthlete, and SAT, the regression package returns a value of 1.10. What are the degrees of freedom for the statistic? Look up the 1% and 5% critical values from the F- table and make a decision about the exclusion of these variables based on the critical values. (c) The Dean decides to estimate the following specification next: Gendercomp = 29.07- (3.75)3.80(0.62)*Size- 9.75(1.04)*DCoed + 1.50 (1.04)*DCons+ 1.97(1.44)*SibOther R2 = 0.22 SER = 15.44 Calculate the t-statistics for the coefficients and discuss whether or not the Dean should attempt to simplify the specification further. Based on the results, what might some of the comments be that she will write up for the other senior administrators of Brock? What are some of the potential flaws in her analysis? What other variables do you think she should have considered as explanatory factors? Brock's administration is thinking about implementing a policy of coed floors only in dormitories. Currently there are only single gender floors. One reason behind such a policy might be to generate an atmosphere of better "understanding" between the sexes. The Dean of Students (DoS) has decided to investigate if such a behavior results in more "togetherness" by attempting to find the determinants of the gender composition at the dinner table in your main dining hall, and in that of McMaster University, which only allows for coed floors in their dorms. The survey includes 176 students, 63 from Brock, and 113 from McMaster. The Dean's first problem is how to define gender composition. To begin with, the survey excludes single persons' tables, since the study is to focus on group behavior. The Dean also eliminates sports teams from the analysis, since a large number of single-gender students will sit at the same table. Finally, the Dean decides to only analyze tables with three or more students, since she worries about "couples" distorting the results. The Dean finally settles for the following specification of the dependent variable: GenderComp= | (50%-% of Male Students at Table)| Where " |(...z...)| " stands for the absolute value of (...Z...). The variable can take on values from zero to fifty. After considering various explanatory variables, the Dean settles for an initial list of eight, and estimates the following relationship, using heteroskedasticity-robust standard errors (this Dean obviously has taken an econometrics course earlier in her career and/or has an able research assistant): Gendercomp = 30.90- (7.73)3.78(0.63)*Size- 8.81(2.66)*DCoed + 2.28 (2.42)*DFemme +2.06 (2.39)*DRommmate- 0.17(3.23)*DAthlete + 1.49 (1.10)* DCons- 0.81(1.20)*SAT+ 1.74(1.43)*SibOther R2= 0.24, SER = 15.50 Where: Size is the number of persons at the table minus 3; DCoed is a binary variable, which takes on the value of 1 if you live on a coed floor, and 0 if otherwise; DFemme is a binary variable, which is 1 for females and zero otherwise; DRoommate is a binary variable which equals 1 if the person at the table has a roommate and is zero otherwise; DAthlete is a binary variable which is 1 if the person at the table is a ECON2P91 - Business Econometrics with Applications Makeup Assignment - (FALL 2020) Page 4|6 member of an athletic varsity team; DCons is a variable which measures the political tendency of the person at the table on a seven-point scale, ranging from 1 being "liberal" to 7 being "conservative"; SAT is the SAT score of the person at the table measured on a seven-point scale, ranging from 1 for the category "900-1000" to 7 for the category "1510 and above"; and increasing by one for 100 point increases (we are considering the same SAT scaling between Canada & US education systems); and SibOther is the number of siblings from the opposite gender in the family the person at the table grew up with. (a) Indicate which of the coefficients are statistically significant. (b) Based on the above results, the Dean decides to specify a more parsimonious form by eliminating the least significant variables. Using the F-statistic for the null hypothesis that there is no relationship between the gender composition at the table and DFemme, DRoommate, DAthlete, and SAT, the regression package returns a value of 1.10. What are the degrees of freedom for the statistic? Look up the 1% and 5% critical values from the F- table and make a decision about the exclusion of these variables based on the critical values. (c) The Dean decides to estimate the following specification next: Gendercomp = 29.07- (3.75)3.80(0.62)*Size- 9.75(1.04)*DCoed + 1.50 (1.04)*DCons+ 1.97(1.44)*SibOther R2 = 0.22 SER = 15.44 Calculate the t-statistics for the coefficients and discuss whether or not the Dean should attempt to simplify the specification further. Based on the results, what might some of the comments be that she will write up for the other senior administrators of Brock? What are some of the potential flaws in her analysis? What other variables do you think she should have considered as explanatory factors? Brock's administration is thinking about implementing a policy of coed floors only in dormitories. Currently there are only single gender floors. One reason behind such a policy might be to generate an atmosphere of better "understanding" between the sexes. The Dean of Students (DoS) has decided to investigate if such a behavior results in more "togetherness" by attempting to find the determinants of the gender composition at the dinner table in your main dining hall, and in that of McMaster University, which only allows for coed floors in their dorms. The survey includes 176 students, 63 from Brock, and 113 from McMaster. The Dean's first problem is how to define gender composition. To begin with, the survey excludes single persons' tables, since the study is to focus on group behavior. The Dean also eliminates sports teams from the analysis, since a large number of single-gender students will sit at the same table. Finally, the Dean decides to only analyze tables with three or more students, since she worries about "couples" distorting the results. The Dean finally settles for the following specification of the dependent variable: GenderComp= | (50%-% of Male Students at Table)| Where " |(...z...)| " stands for the absolute value of (...Z...). The variable can take on values from zero to fifty. After considering various explanatory variables, the Dean settles for an initial list of eight, and estimates the following relationship, using heteroskedasticity-robust standard errors (this Dean obviously has taken an econometrics course earlier in her career and/or has an able research assistant): Gendercomp = 30.90- (7.73)3.78(0.63)*Size- 8.81(2.66)*DCoed + 2.28 (2.42)*DFemme +2.06 (2.39)*DRommmate- 0.17(3.23)*DAthlete + 1.49 (1.10)* DCons- 0.81(1.20)*SAT+ 1.74(1.43)*SibOther R2= 0.24, SER = 15.50 Where: Size is the number of persons at the table minus 3; DCoed is a binary variable, which takes on the value of 1 if you live on a coed floor, and 0 if otherwise; DFemme is a binary variable, which is 1 for females and zero otherwise; DRoommate is a binary variable which equals 1 if the person at the table has a roommate and is zero otherwise; DAthlete is a binary variable which is 1 if the person at the table is a ECON2P91 - Business Econometrics with Applications Makeup Assignment - (FALL 2020) Page 4|6 member of an athletic varsity team; DCons is a variable which measures the political tendency of the person at the table on a seven-point scale, ranging from 1 being "liberal" to 7 being "conservative"; SAT is the SAT score of the person at the table measured on a seven-point scale, ranging from 1 for the category "900-1000" to 7 for the category "1510 and above"; and increasing by one for 100 point increases (we are considering the same SAT scaling between Canada & US education systems); and SibOther is the number of siblings from the opposite gender in the family the person at the table grew up with. (a) Indicate which of the coefficients are statistically significant. (b) Based on the above results, the Dean decides to specify a more parsimonious form by eliminating the least significant variables. Using the F-statistic for the null hypothesis that there is no relationship between the gender composition at the table and DFemme, DRoommate, DAthlete, and SAT, the regression package returns a value of 1.10. What are the degrees of freedom for the statistic? Look up the 1% and 5% critical values from the F- table and make a decision about the exclusion of these variables based on the critical values. (c) The Dean decides to estimate the following specification next: Gendercomp = 29.07- (3.75)3.80(0.62)*Size- 9.75(1.04)*DCoed + 1.50 (1.04)*DCons+ 1.97(1.44)*SibOther R2 = 0.22 SER = 15.44 Calculate the t-statistics for the coefficients and discuss whether or not the Dean should attempt to simplify the specification further. Based on the results, what might some of the comments be that she will write up for the other senior administrators of Brock? What are some of the potential flaws in her analysis? What other variables do you think she should have considered as explanatory factors?
Expert Answer:
Answer rating: 100% (QA)
The administration of your universitycollege is thinking about implementing a policy of coed floors ... View the full answer

Related Book For 

Posted Date:
Students also viewed these accounting questions
-
A researcher on superstition decided to investigate if walking under a ladder really brought about bad luck. He took 100 people to his laboratory, one at a time. As each person entered, he flipped a...
-
An anti-doping agency decided to investigate if an athletes eliteness was related to the likelihood of doping. It unexpectedly drug-tested the top 10 finishers in all the track and field events at a...
-
The dean of the graduate business administration school at University of Texas at Austin wants to select a sample of 100 students who applied to one of five majors. The numbers of applicants for each...
-
Determine the reactions at the beam supports for the given loading when wO = 400 lb/ft. 300 lb/ft A. 5 ft
-
Compute departures and latitudes, linear misclosure, and relative precision for the traverse of Problem 10.6 if the lengths of the sides (in feet) are as follows: AB = 2157.34; BC = 1722.58; CD =...
-
Solve Problem 2.121 assuming that a third worker is exerting a force (180 P= N)i on the counterweight. Problem 2.121: Using two ropes and a roller chute, two workers are unloading a 200-kg cast-iron...
-
In 1951, DuPont began using the chemical perfluorooctanoic acid to manufacture Teflon. Due to the dangerous nature of the chemical, DuPont was given special instructions by its supplier to dispose of...
-
Examine the tests of controls and substantive tests of transactions results, including the sampling application in Case 18-32, for Ward Publishing Company. Assume that you have already reached...
-
3. A 200 kg roller coaster starts from rest at the top of the first hill at a height of 20 m above the ground. The second hill is 15 m above the ground. a. A physics student in line for the ride...
-
Let F be the language of all strings over {0,1} that do not contain a pair of 1s that are separated by an odd number of symbols. Give the state diagram of a DFA with five states that recognizes F....
-
Creative Computing sells a tablet called the Protab. The $970 sale price of a Protab package includes the following: A Protab computer. A 6-month limited warranty. This warranty guarantees that...
-
The right to buy crude oil for 70 USD per barrel one year from now costs $5. The right to sell crude oil for 70 USD per barrel one year from now costs $4. If the continuous interest rate is 7%...
-
A firm currently has total debt equal to $89 millions of dollars. They are considering changing that to a total amount of debt of $114. If they implement this change, what would be the change in the...
-
Scenario 1 (Expected) : The expected volume of U.S. sales in 2020 is 2,500 Junior Genius Kits. Scenario 2 (Pandemic) : The low-sales scenario is 50% lower than the expected sales volume. Assume, in...
-
Assume that all interest rates are certain - all investors know how interest rates will change over time. Three years ago, you purchased a 10-year bond with a face value of $1,000.00 and annual...
-
In TMax.java, complete the getRandomArray() method that is responsible to generate a one dimensional random array with the size of a random number between 2 and 10. Then populate the Array with some...
-
Find the voltage across each resistor (VRX) and the current in each resistor (IRX) in Fig L1.2. Assume the following values for the resistors: R1 = 1 K:, R2 = 4.7 K:, R3= 10 K:, R4 = 4.7 K., R5= 1...
-
Conduct a VRIO analysis by ranking Husson University (in Maine) business school in terms of the following six dimensions relative to the top three rival schools. If you were the dean with a limited...
-
f(x) = 2x, g(x) = -2x Graph both functions by hand on the same coordinate system.
-
a. Carefully graph the given equation by hand. Then find the slope of the line by using the ratio rise/run. i. y = 2x + 1 ii. y = 3x 5 iii. Y = 2x + 6 b. Compare the slope of each line with the...
-
Y = 2 Determine the slope and the y-intercept. Use them to graph the equation by hand
-
A candlestick chart is similar to a bar chart except that the candlestick chart: A. Represents upward movements in price with Xs. B. Also graphically shows the range of the periods highs and lows. C....
-
What considerations might encourage a market analyst to rely more on a top-down or bottom-up forecast of S&P 500 operating earnings?
-
Which of the following advantages listed by Ryan with respect to the earnings-based approach studied by Atkinson is most likely correct? The model A. Can be used for non-U.S. equity markets. B....

Study smarter with the SolutionInn App