

Historical data shows that the average annual rate of return on the S&P 500 portfolio over the
Fantastic news! We've Found the answer you've been seeking!
Question:
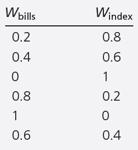
Historical data shows that the average annual rate of return on the S&P 500 portfolio over the past 90 years has averaged roughly 8% more than the Treasury bill return and that the S&P 500 standard deviation has been about 21% per year. Assume these values are representative of investors' expectations for future performance and that the current T-bill rate is 4%. Calculate the expected return and variance of portfolios invested in T-bills and the S&P 500 index with weights as follows:
Calculate the utility levels of each portfolio with different weights for an investor with A = 2. What do you conclude? Which portfolio should the investor choose? Repeat the same for an investor with A=4.
Expert Answer:

Related Book For 

Posted Date:
