

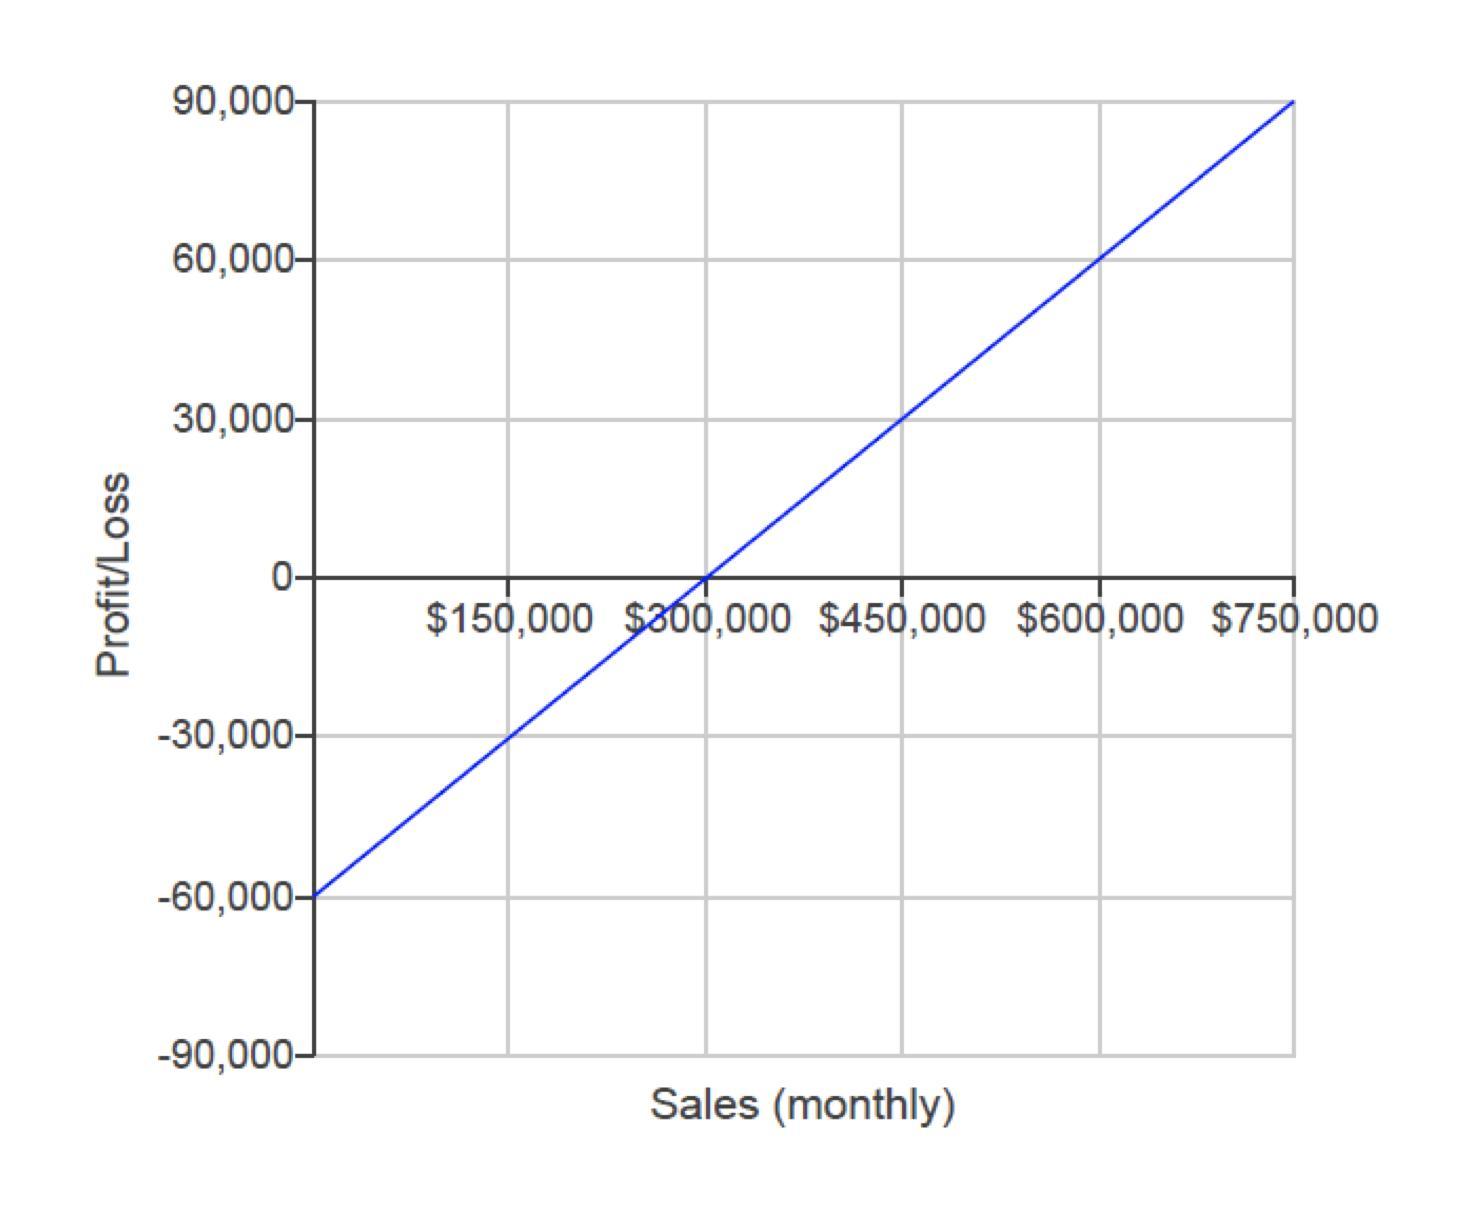
The below chart shows the expected monthly profit or loss of Horizon Company within the range of
Fantastic news! We've Found the answer you've been seeking!
Question:
The below chart shows the expected monthly profit or loss of Horizon Company within the range of its monthly practical operating capacity. Using the information provided in the chart, answer the following questions.
a) (10 pts) What is the company's break-even sales?
b) (10 pts) What would be the value of break-even sales if the fixed cost increases by 20%, while everything else stays constant?
Expert Answer:

Related Book For 
Intermediate Accounting
ISBN: 978-0132162302
1st edition
Authors: Elizabeth A. Gordon, Jana S. Raedy, Alexander J. Sannella
Posted Date:
