

7. Calculate Walgreens (WBA)'s inventory turnover ratios for the ten year period ending this year, using:...
Fantastic news! We've Found the answer you've been seeking!
Question:

Transcribed Image Text:
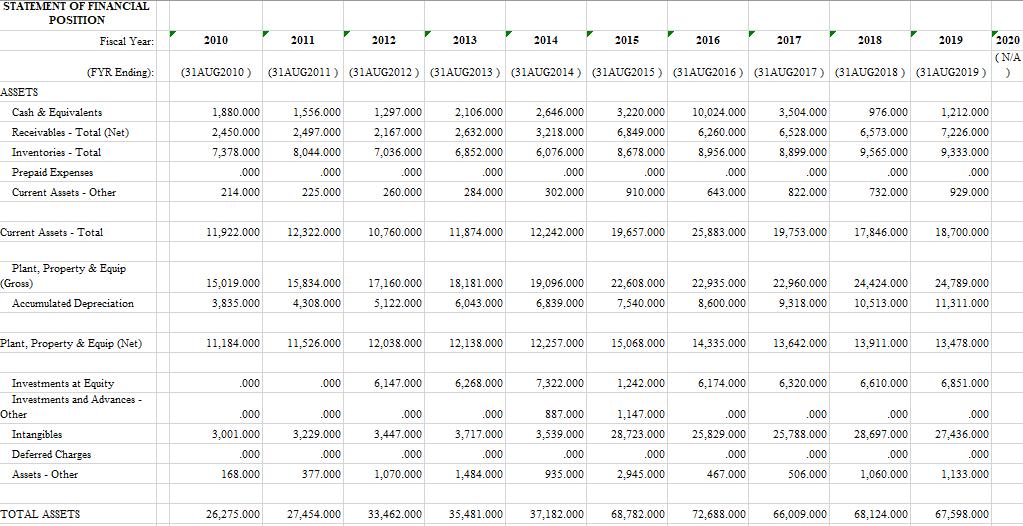
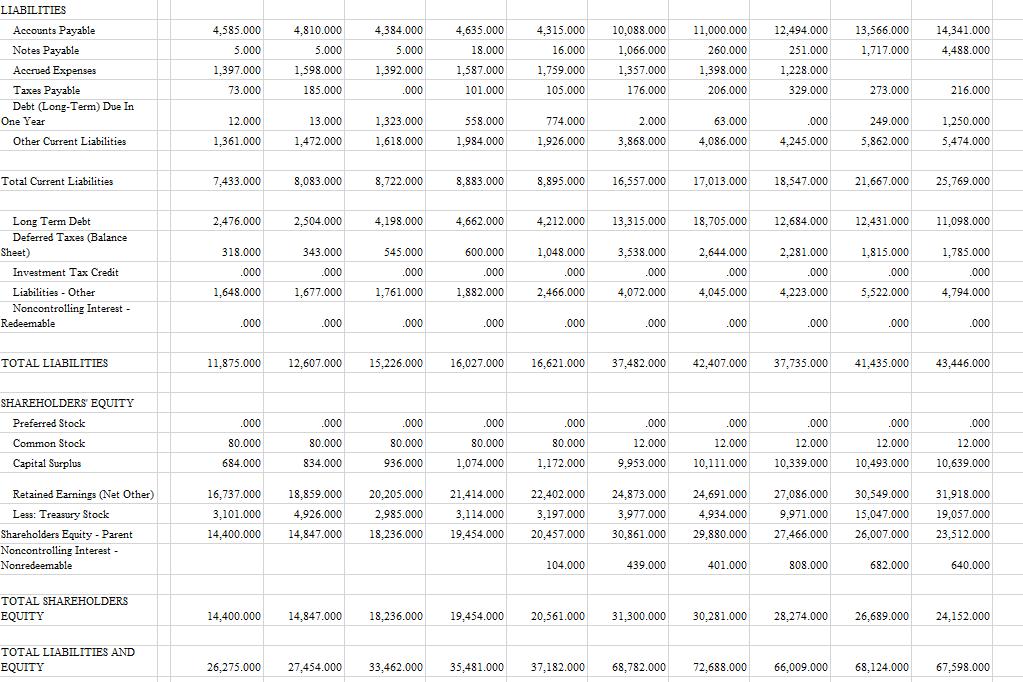
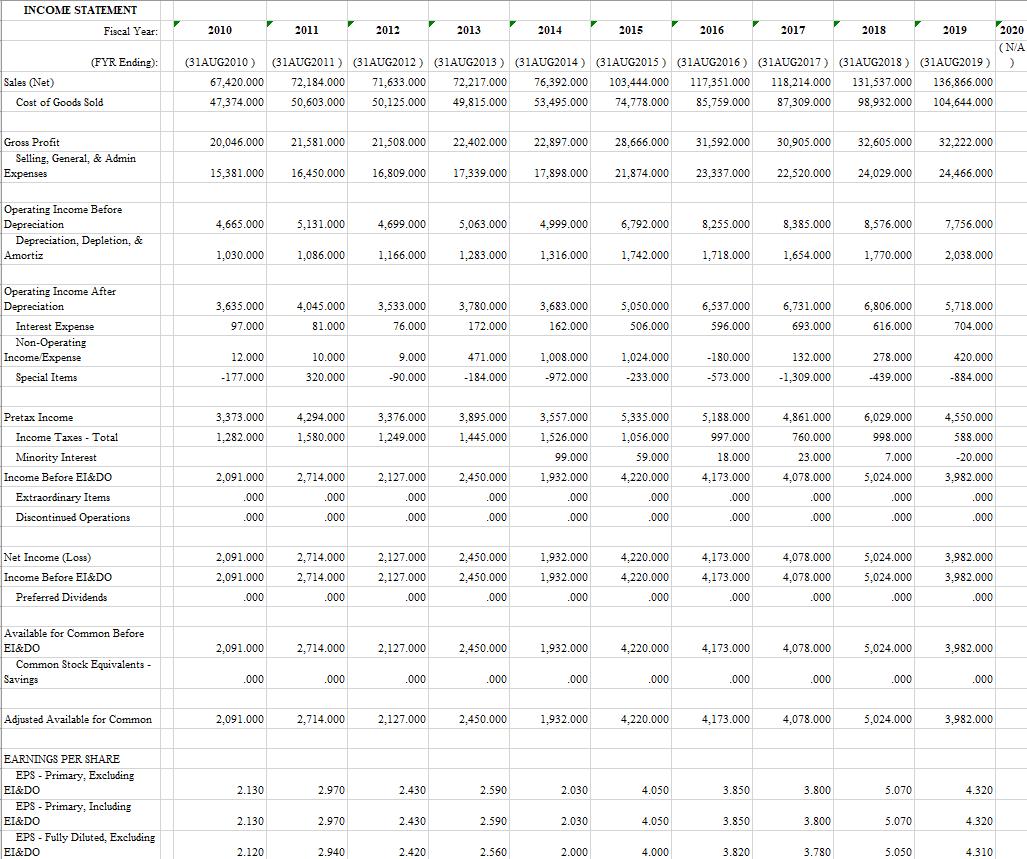
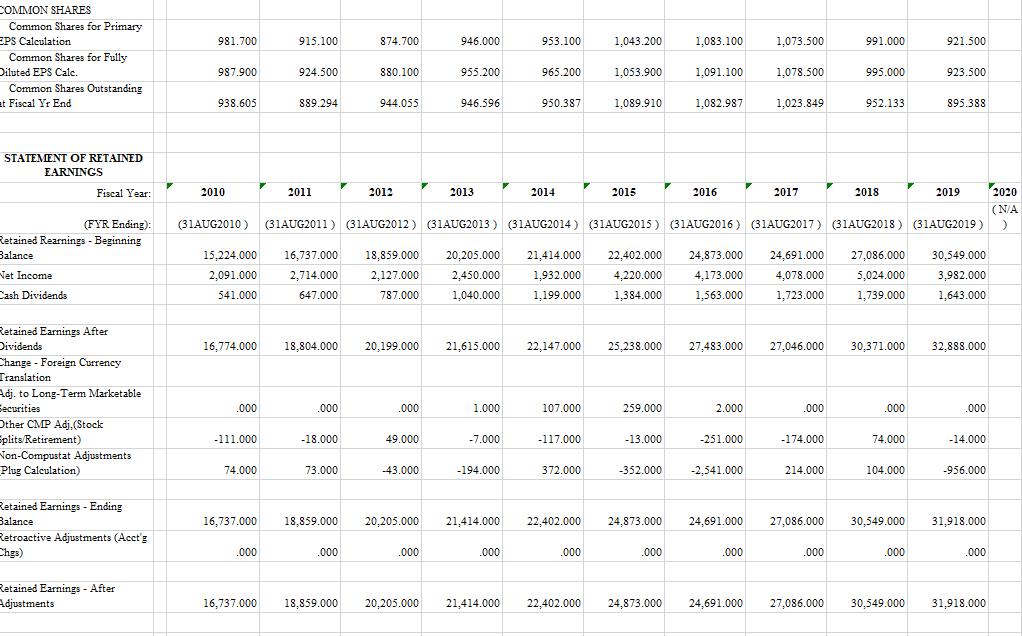
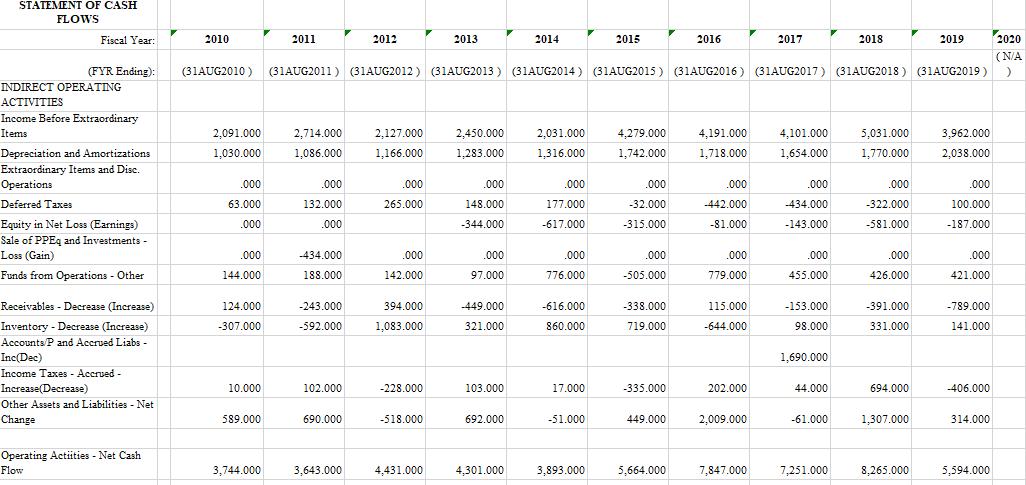
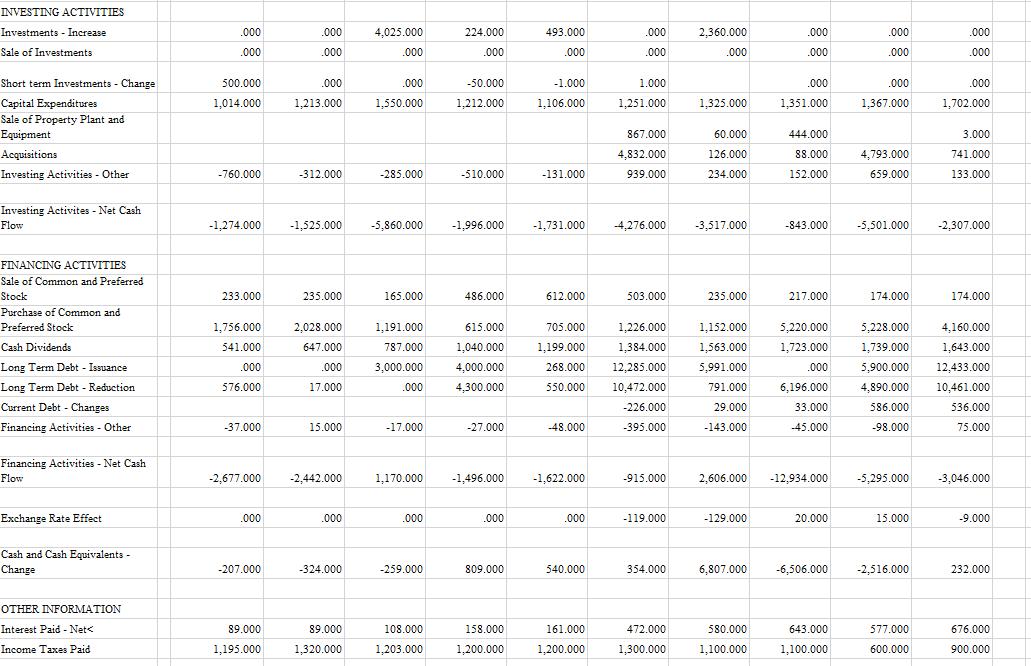
7. Calculate Walgreens (WBA)'s inventory turnover ratios for the ten year period ending this year, using: (I) LIFO data (ii) FIFO data (iii) Current cost data. Discuss the differences among these three turnover ratios and select the method that provides the best measure of economic turnover. Discuss the trend in Walgreens (WBA)'s inventory turnover over the ten year period. Discuss factors that might account for the variability of reported turnover. STATEMENT OF FINANCIAL POSITION Fiscal Year: 2010 2011 2012 2013 2014 2015 2016 2017 2018 2019 2020 (N/A) (FYR Ending): (31AUG2010) (31AUG2011) (31AUG2012) (31AUG2013) (31AUG2014) (31AUG2015) (31AUG2016) (31AUG2017) (31AUG2018) (31AUG2019)) ASSETS 1,880.000 1,297.000 2,106.000 976.000 1,212.000 1,556.000 2,497.000 2,646.000 3,218.000 2,450.000 3.220.000 6,849.000 8,678.000 2,167.000 7,036.000 6,573.000 10,024.000 3,504.000 6,260.000 6,528.000 8,956.000 8,899.000 2,632.000 6,852.000 7,226.000 7,378.000 8,044.000 6,076.000 9,565.000 9,333.000 .000 .000 .000 .000 .000 .000 1.000 302.000 .000 910.000 .000 643.000 .000 822.000 214.000 225.000 260.000 284.000 732.000 929.000 11,922.000 12,322.000 10,760.000 11,874.000 12,242.000 19,657.000 25,883.000 19,753.000 17,846.000 18,700.000 15.019.000 15,834.000 17,160.000 18,181.000 19,096.000 24,789.000 22,608.000 22,935.000 22,960.000 24,424.000 7,540.000 8,600.000 9,318.000 10,513.000 3,835.000 4,308.000 5,122.000 6,043.000 6,839.000 11,311.000 11,184.000 11,526.000 12,038.000 12,138.000 12,257.000 15,068.000 14,335.000 13,642.000 13.911.000 13,478.000 .000 .000 6,147.000 6,268.000 7,322.000 1,242.000 6,174.000 6,610.000 6,851.000 .000 .000 3,229.000 .000 3,447.000 .000 1,070.000 3,001.000 .000 .000 3,717.000 .000 1,484.000 887.000 1,147.000 3,539.000 28,723.000 .000 .000 935.000 2,945.000 6,320.000 .000 25,788.000 .000 506.000 .000 25,829.000 .000 467.000 .000 28,697.000 .000 .000 27,436.000 .000 1,133.000 .000 377.000 168.000 1,060.000 26,275.000 27,454.000 33,462.000 35,481.000 37,182.000 68,782.000 72.688.000 66.009.000 68,124.000 67,598.000 Cash & Equivalents Receivables Total (Net) Inventories - Total Prepaid Expenses Current Assets - Other Current Assets - Total Plant, Property & Equip (Gross) Accumulated Depreciation Plant, Property & Equip (Net) Investments at Equity Investments and Advances - Other Intangibles Deferred Charges Assets Other TOTAL ASSETS LIABILITIES Accounts Payable Notes Payable Accrued Expenses Taxes Payable Debt (Long-Term) Due In One Year Other Current Liabilities Total Current Liabilities Long Term Debt Deferred Taxes (Balance Sheet) Investment Tax Credit Liabilities Other - Noncontrolling Interest - Redeemable TOTAL LIABILITIES SHAREHOLDERS' EQUITY Preferred Stock Common Stock Capital Surplus Retained Earnings (Net Other) Less: Treasury Stock Shareholders Equity - Parent Noncontrolling Interest - Nonredeemable TOTAL SHAREHOLDERS EQUITY TOTAL LIABILITIES AND EQUITY 4,585.000 4,810.000 4.384.000 4,635.000 4,315.000 10,088.000 11,000.000 12,494.000 13,566.000 14,341.000 5.000 5.000 5.000 1,066.000 251.000 1,717.000 4,488.000 18.000 1,587.000 16.000 1,759.000 260.000 1,398.000 1,397.000 1,598.000 1,392.000 1,357.000 1,228.000 73.000 185.000 .000 101.000 105.000 176.000 206.000 329.000 273.000 216.000 12.000 13.000 1,323.000 558.000 774.000 2.000 .000 249.000 1,250.000 63.000 4,086.000 1.361.000 1,472.000 1,618.000 1,984.000 1,926.000 3,868.000 4,245.000 5,862.000 5,474.000 7,433.000 8,083.000 8,722.000 8,883.000 8,895.000 16,557.000 17,013.000 18,547.000 21,667.000 25,769.000 2,476.000 2,504.000 4,198.000 4,662.000 4,212.000 13,315.000 18,705.000 12,684.000 12,431.000 11,098.000 318.000 1,815.000 .000 343.000 .000 1.677.000 545.000 .000 1,761.000 600.000 .000 1,882.000 1,048.000 .000 2,466.000 .000 3,538.000 .000 4,072.000 .000 2,644.000 2,281.000 .000 .000 4,045.000 4,223.000 1,648.000 .000 5,522.000 .000 1,785.000 .000 4.794.000 .000 .000 .000 .000 .000 .000 .000 11,875.000 12,607.000 15,226.000 16,027.000 16,621.000 37,482.000 42,407.000 37,735.000 41,435.000 43,446.000 .000 80.000 .000 80.000 .000 80.000 .000 80.000 1,074.000 .000 80.000 1,172.000 .000 .000 12.000 12.000 9,953.000 10,111.000 .000 12.000 10,339.000 .000 12.000 .000 12.000 684.000 834.000 936.000 10,493.000 10,639.000 16,737.000 18,859.000 20,205.000 21,414.000 31.918.000 4.926.000 2.985.000 3,114.000 22,402.000 3,197.000 20,457.000 3,101.000 14,400.000 14,847.000 18,236.000 19,454.000 24,873.000 24,691.000 3,977.000 4,934.000 30,861.000 29,880.000 19,057.000 27,086.000 30,549.000 9,971.000 15.047.000 27,466.000 26,007.000 682.000 23,512.000 104.000 439.000 401.000 808.000 640.000 14,400.000 14,847.000 18,236.000 19,454.000 20,561.000 31,300.000 30,281.000 28,274.000 26,689.000 24,152.000 26,275.000 27,454.000 33,462.000 35,481.000 37,182.000 68,782.000 72,688.000 66,009.000 68,124.000 67,598.000 INCOME STATEMENT Sales (Net) Fiscal Year: 2011 2012 2013 2014 2015 2016 2017 2018 2019 2020 (N/A (FYR Ending) 2010 (31AUG2010) (31AUG2011) (31AUG2012) (31AUG2013) (31AUG2014) (31AUG2015) (31AUG2016) (31AUG2017) (31AUG2018) (31AUG2019) ) 67,420.000 72,184.000 71,633.000 72,217.000 76,392.000 103,444.000 117,351.000 118,214.000 131,537.000 136,866.000 47,374.000 50,603.000 50,125.000 49.815.000 53,495.000 74,778.000 85,759.000 87,309.000 98,932.000 104,644.000 20,046.000 21.581.000 21,508.000 22,402.000 22,897.000 28,666.000 31,592.000 30,905.000 32.605.000 32,222.000 15,381.000 16,450.000 16,809.000 17,339.000 17,898.000 21,874.000 23.337.000 22,520.000 24,029.000 24,466.000 4,665.000 5,131.000 4,699.000 5,063.000 4,999.000 6,792.000 8,255.000 8,385.000 8,576.000 7,756.000 1,030.000 1,086.000 1,166.000 1,283.000 1,316.000 1,742.000 1,718.000 1,654.000 1,770.000 2,038.000 3,635.000 4,045.000 3,533.000 3,780.000 3,683.000 5,050.000 6,537.000 6,731.000 6,806.000 5,718.000 97.000 81.000 76.000 172.000 162.000 506.000 596.000 693.000 616.000 704.000 12.000 10.000 9.000 471.000 1,008.000 1,024.000 -180.000 132.000 278.000 420.000 -177.000 320.000 -90.000 -184.000 -972.000 -233.000 -573.000 -1,309.000 -439.000 -884.000 3,373.000 4,294.000 3,376.000 3,895.000 3,557.000 5,335.000 4,861.000 6,029.000 4,550.000 1,282.000 1,580.000 1,249.000 1,445.000 1,056.000 5,188.000 997.000 18.000 998.000 1,526.000 99.000 588.000 760.000 23.000 4,078.000 7.000 59.000 4,220.000 -20.000 2,091.000 2,714.000 2,127.000 2,450.000 1,932.000 4,173.000 5,024.000 3,982.000 .000 .000 .000 .000 .000 .000 .000 .000 .000 .000 .000 .000 .000 .000 .000 .000 .000 .000 .000 .000 2,091.000 2,714.000 2,091.000 .000 2,714.000 .000 2,127.000 2,127.000 .000 2,450.000 2,450.000 .000 1,932.000 1,932.000 .000 4,220.000 4,220.000 .000 4,173.000 4,173.000 .000 4,078.000 4,078.000 .000 5,024.000 5,024.000 .000 3,982.000 3,982.000 .000 2,091.000 3,982.000 2,714.000 .000 2,127.000 .000 2,450.000 .000 1,932.000 .000 4,220.000 .000 4,173.000 .000 4,078.000 .000 5,024.000 .000 .000 .000 2.091.000 2,714.000 2.127.000 2,450.000 1,932.000 4,220.000 4,173.000 4,078.000 5,024.000 3.982,000 2.130 2.970 2.430 2.590 2.030 4.050 3.850 3.800 5.070 4.320 2.130 2.970 2.430 2.590 2.030 4.050 3.850 3.800 5.070 4.320 2.120 2.940 2.420 2.560 2.000 4.000 3.820 3.780 5.050 4.310 Cost of Goods Sold Gross Profit Selling, General, & Admin Expenses Operating Income Before Depreciation Depreciation, Depletion, & Amortiz Operating Income After Depreciation Interest Expense Non-Operating Income Expense Special Items Pretax Income Income Taxes - Total Minority Interest Income Before EI&DO Extraordinary Items Discontinued Operations Net Income (Loss) Income Before EI&DO Preferred Dividends Available for Common Before EI&DO Common Stock Equivalents - Savings Adjusted Available for Common EARNINGS PER SHARE EPS - Primary, Excluding EI&DO EPS - Primary, Including EI&DO EPS -Fully Diluted, Excluding EI&DO COMMON SHARES Common Shares for Primary EPS Calculation 1,043.200 1,083.100 1,073.500 Common Shares for Fully Diluted EPS Calc. 1,053.900 1,091.100 1,078.500 Common Shares Outstanding at Fiscal Yr End 1,089.910 1,082.987 1,023.849 STATEMENT OF RETAINED EARNINGS Fiscal Year: 2010 2011 2012 2013 2014 2015 2016 2017 2018 2019 2020 (N/A (FYR Ending): Retained Rearnings - Beginning Balance (31AUG2010) (31AUG2011) (31AUG2012) (31AUG2013) (31AUG2014) (31AUG2015) (31AUG2016) (31AUG2017) (31AUG2018) (31AUG2019) ) 24,873.000 24,691.000 27,086.000 4,173.000 4,078.000 5,024.000 1,563.000 1,723.000 30,549.000 15,224.000 16,737.000 2,091.000 Net Income 2,714.000 18,859.000 20,205.000 21,414.000 22,402.000 1,932.000 4,220.000 1.199.000 1,384.000 3.982.000 2,127.000 787.000 2,450.000 1,040.000 Cash Dividends 541.000 647.000 1,739.000 1,643.000 Retained Earnings After Dividends 16,774.000 18,804.000 20,199.000 21,615.000 22,147.000 25,238.000 27,483.000 27,046.000 30,371.000 32,888.000 Change - Foreign Currency Translation Adj. to Long-Term Marketable Securities .000 .000 .000 1.000 107.000 2.000 .000 .000 .000 Other CMP Adj. (Stock Splits/Retirement) -111.000 -18.000 49.000 -7.000 -117.000 259.000 -13.000 -352.000 74.000 -14.000 Non-Compustat Adjustments -251.000 -2,541.000 -174.000 214.000 Plug Calculation) 74.000 73.000 -43.000 -194.000 372.000 104.000 -956.000 Retained Earnings - Ending Balance 16,737.000 18,859.000 20,205.000 21,414.000 22,402.000 24,873.000 24,691.000 27,086.000 30,549.000 31.918.000 Retroactive Adjustments (Acct'g Chgs) .000 .000 .000 .000 .000 .000 .000 .000 .000 .000 Retained Earnings - After Adjustments 16,737.000 18,859.000 20,205.000 21,414.000 22,402.000 24,873.000 24,691.000 27,086.000 30,549.000 31,918.000 981.700 987.900 938.605 915.100 924.500 889.294 874.700 880.100 944.055 946.000 955.200 946.596 953.100 965.200 950.387 991.000 995.000 952.133 921.500 923.500 895.388 STATEMENT OF CASH FLOWS Fiscal Year: 2010 2011 2012 2013 2014 2015 2016 2017 2018 2019 2020 (N/A (FYR Ending): (31AUG2010) (31AUG2011) (31AUG2012) (31AUG2013) (31AUG2014) (31AUG2015) (31AUG2016) (31AUG2017) (31AUG2018) (31AUG2019) ) 2,091.000 1,030.000 2,714.000 1,086.000 2,127.000 1,166.000 2,450.000 1,283.000 2,031.000 1,316.000 4,279.000 1,742.000 4,191.000 1.718.000 4,101.000 1,654.000 5,031.000 1,770.000 3,962.000 2,038.000 .000 63.000 .000 132.000 .000 265.000 .000 148.000 -344.000 .000 177.000 -617.000 .000 -32.000 -315.000 .000 -442.000 -81.000 .000 -434.000 -143.000 .000 -322.000 -581.000 .000 100.000 -187.000 .000 .000 .000 -434.000 .000 142.000 .000 97.000 .000 776.000 .000 -505.000 .000 779.000 .000 455.000 .000 426.000 .000 421.000 144.000 188.000 124.000 -243.000 394.000 -449.000 -338.000 115.000 -391.000 -789.000 -616.000 860.000 -153.000 98.000 -307.000 -592.000 1,083.000 321.000 719.000 -644.000 331.000 141.000 1,690.000 10.000 102.000 -228.000 103.000 17.000 -335.000 202.000 44.000 694.000 -406.000 589.000 690.000 -518.000 692.000 -51.000 449.000 2,009.000 -61.000 1,307.000 314.000 3,744.000 3,643.000 4,431.000 4,301.000 3,893.000 5,664.000 7,847.000 7,251.000 8.265.000 5,594.000 INDIRECT OPERATING ACTIVITIES Income Before Extraordinary Items Depreciation and Amortizations Extraordinary Items and Disc. Operations Deferred Taxes Equity in Net Loss (Earnings) Sale of PPEq and Investments - Loss (Gain) Funds from Operations - Other Receivables - Decrease (Increase) Inventory - Decrease (Increase) Accounts/P and Accrued Liabs - Inc(Dec) Income Taxes - Accrued - Increase(Decrease) Other Assets and Liabilities - Net Change Operating Actiities - Net Cash Flow INVESTING ACTIVITIES Investments - Increase Sale of Investments Short term Investments - Change Capital Expenditures Sale of Property Plant and Equipment Acquisitions Investing Activities - Other Investing Activites - Net Cash Flow FINANCING ACTIVITIES Sale of Common and Preferred Stock Purchase of Common and Preferred Stock Cash Dividends Long Term Debt - Issuance Long Term Debt - Reduction Current Debt Changes Financing Activities - Other Financing Activities - Net Cash Flow Exchange Rate Effect Cash and Cash Equivalents - Change OTHER INFORMATION Interest Paid - Net< Income Taxes Paid .000 .000 500.000 1,014.000 -760.000 -1,274.000 233.000 1,756.000 541.000 .000 576.000 -37.000 -2,677.000 .000 -207.000 89.000 1,195.000 .000 .000 .000 1,213.000 -312.000 -1,525.000 235.000 2,028.000 647.000 .000 17.000 15.000 -2,442.000 .000 -324.000 89.000 1,320.000 4,025.000 224.000 493.000 .000 .000 .000 .000 -50.000 1,212.000 -1.000 1,106.000 1.550.000 -285.000 -510.000 -131.000 -5,860.000 -1,996.000 -1,731.000 165.000 486.000 612.000 1,191.000 615.000 705.000 1,199.000 787.000 1,040.000 3,000.000 .000 4,000.000 4,300.000 268.000 550.000 -17.000 -27.000 -48.000 1,170.000 -1,496.000 -1,622.000 .000 .000 .000 -259.000 809.000 540.000 108.000 158.000 161.000 1,203.000 1,200.000 1,200.000 .000 .000 1.000 1.251.000 867.000 4,832.000 939.000 -4,276.000 503.000 1,226.000 1,384.000 12,285.000 10,472.000 -226.000 -395.000 -915.000 -119.000 354.000 472.000 1,300.000 2,360.000 .000 .000 .000 .000 1.325.000 1,351.000 60.000 126.000 444.000 88.000 234.000 152.000 -3,517.000 -843.000 235.000 217.000 1,152.000 1,563.000 5,220.000 1,723.000 .000 6,196.000 5,991.000 791.000 33.000 29.000 -143.000 -45.000 2,606.000 -12,934.000 -129.000 20.000 6,807.000 -6.506.000 580.000 643.000 1,100.000 1,100.000 .000 .000 .000 .000 .000 .000 1,367.000 1,702.000 4,793.000 659.000 3.000 741.000 133.000 -5,501.000 -2,307.000 174.000 174.000 5.228.000 4,160.000 1,739.000 1,643.000 12,433.000 5.900.000 4,890.000 10,461.000 586.000 536.000 -98.000 75.000 -5,295.000 -3,046.000 15.000 -9.000 -2,516.000 232.000 577.000 676.000 600.000 900.000 7. Calculate Walgreens (WBA)'s inventory turnover ratios for the ten year period ending this year, using: (I) LIFO data (ii) FIFO data (iii) Current cost data. Discuss the differences among these three turnover ratios and select the method that provides the best measure of economic turnover. Discuss the trend in Walgreens (WBA)'s inventory turnover over the ten year period. Discuss factors that might account for the variability of reported turnover. STATEMENT OF FINANCIAL POSITION Fiscal Year: 2010 2011 2012 2013 2014 2015 2016 2017 2018 2019 2020 (N/A) (FYR Ending): (31AUG2010) (31AUG2011) (31AUG2012) (31AUG2013) (31AUG2014) (31AUG2015) (31AUG2016) (31AUG2017) (31AUG2018) (31AUG2019)) ASSETS 1,880.000 1,297.000 2,106.000 976.000 1,212.000 1,556.000 2,497.000 2,646.000 3,218.000 2,450.000 3.220.000 6,849.000 8,678.000 2,167.000 7,036.000 6,573.000 10,024.000 3,504.000 6,260.000 6,528.000 8,956.000 8,899.000 2,632.000 6,852.000 7,226.000 7,378.000 8,044.000 6,076.000 9,565.000 9,333.000 .000 .000 .000 .000 .000 .000 1.000 302.000 .000 910.000 .000 643.000 .000 822.000 214.000 225.000 260.000 284.000 732.000 929.000 11,922.000 12,322.000 10,760.000 11,874.000 12,242.000 19,657.000 25,883.000 19,753.000 17,846.000 18,700.000 15.019.000 15,834.000 17,160.000 18,181.000 19,096.000 24,789.000 22,608.000 22,935.000 22,960.000 24,424.000 7,540.000 8,600.000 9,318.000 10,513.000 3,835.000 4,308.000 5,122.000 6,043.000 6,839.000 11,311.000 11,184.000 11,526.000 12,038.000 12,138.000 12,257.000 15,068.000 14,335.000 13,642.000 13.911.000 13,478.000 .000 .000 6,147.000 6,268.000 7,322.000 1,242.000 6,174.000 6,610.000 6,851.000 .000 .000 3,229.000 .000 3,447.000 .000 1,070.000 3,001.000 .000 .000 3,717.000 .000 1,484.000 887.000 1,147.000 3,539.000 28,723.000 .000 .000 935.000 2,945.000 6,320.000 .000 25,788.000 .000 506.000 .000 25,829.000 .000 467.000 .000 28,697.000 .000 .000 27,436.000 .000 1,133.000 .000 377.000 168.000 1,060.000 26,275.000 27,454.000 33,462.000 35,481.000 37,182.000 68,782.000 72.688.000 66.009.000 68,124.000 67,598.000 Cash & Equivalents Receivables Total (Net) Inventories - Total Prepaid Expenses Current Assets - Other Current Assets - Total Plant, Property & Equip (Gross) Accumulated Depreciation Plant, Property & Equip (Net) Investments at Equity Investments and Advances - Other Intangibles Deferred Charges Assets Other TOTAL ASSETS LIABILITIES Accounts Payable Notes Payable Accrued Expenses Taxes Payable Debt (Long-Term) Due In One Year Other Current Liabilities Total Current Liabilities Long Term Debt Deferred Taxes (Balance Sheet) Investment Tax Credit Liabilities Other - Noncontrolling Interest - Redeemable TOTAL LIABILITIES SHAREHOLDERS' EQUITY Preferred Stock Common Stock Capital Surplus Retained Earnings (Net Other) Less: Treasury Stock Shareholders Equity - Parent Noncontrolling Interest - Nonredeemable TOTAL SHAREHOLDERS EQUITY TOTAL LIABILITIES AND EQUITY 4,585.000 4,810.000 4.384.000 4,635.000 4,315.000 10,088.000 11,000.000 12,494.000 13,566.000 14,341.000 5.000 5.000 5.000 1,066.000 251.000 1,717.000 4,488.000 18.000 1,587.000 16.000 1,759.000 260.000 1,398.000 1,397.000 1,598.000 1,392.000 1,357.000 1,228.000 73.000 185.000 .000 101.000 105.000 176.000 206.000 329.000 273.000 216.000 12.000 13.000 1,323.000 558.000 774.000 2.000 .000 249.000 1,250.000 63.000 4,086.000 1.361.000 1,472.000 1,618.000 1,984.000 1,926.000 3,868.000 4,245.000 5,862.000 5,474.000 7,433.000 8,083.000 8,722.000 8,883.000 8,895.000 16,557.000 17,013.000 18,547.000 21,667.000 25,769.000 2,476.000 2,504.000 4,198.000 4,662.000 4,212.000 13,315.000 18,705.000 12,684.000 12,431.000 11,098.000 318.000 1,815.000 .000 343.000 .000 1.677.000 545.000 .000 1,761.000 600.000 .000 1,882.000 1,048.000 .000 2,466.000 .000 3,538.000 .000 4,072.000 .000 2,644.000 2,281.000 .000 .000 4,045.000 4,223.000 1,648.000 .000 5,522.000 .000 1,785.000 .000 4.794.000 .000 .000 .000 .000 .000 .000 .000 11,875.000 12,607.000 15,226.000 16,027.000 16,621.000 37,482.000 42,407.000 37,735.000 41,435.000 43,446.000 .000 80.000 .000 80.000 .000 80.000 .000 80.000 1,074.000 .000 80.000 1,172.000 .000 .000 12.000 12.000 9,953.000 10,111.000 .000 12.000 10,339.000 .000 12.000 .000 12.000 684.000 834.000 936.000 10,493.000 10,639.000 16,737.000 18,859.000 20,205.000 21,414.000 31.918.000 4.926.000 2.985.000 3,114.000 22,402.000 3,197.000 20,457.000 3,101.000 14,400.000 14,847.000 18,236.000 19,454.000 24,873.000 24,691.000 3,977.000 4,934.000 30,861.000 29,880.000 19,057.000 27,086.000 30,549.000 9,971.000 15.047.000 27,466.000 26,007.000 682.000 23,512.000 104.000 439.000 401.000 808.000 640.000 14,400.000 14,847.000 18,236.000 19,454.000 20,561.000 31,300.000 30,281.000 28,274.000 26,689.000 24,152.000 26,275.000 27,454.000 33,462.000 35,481.000 37,182.000 68,782.000 72,688.000 66,009.000 68,124.000 67,598.000 INCOME STATEMENT Sales (Net) Fiscal Year: 2011 2012 2013 2014 2015 2016 2017 2018 2019 2020 (N/A (FYR Ending) 2010 (31AUG2010) (31AUG2011) (31AUG2012) (31AUG2013) (31AUG2014) (31AUG2015) (31AUG2016) (31AUG2017) (31AUG2018) (31AUG2019) ) 67,420.000 72,184.000 71,633.000 72,217.000 76,392.000 103,444.000 117,351.000 118,214.000 131,537.000 136,866.000 47,374.000 50,603.000 50,125.000 49.815.000 53,495.000 74,778.000 85,759.000 87,309.000 98,932.000 104,644.000 20,046.000 21.581.000 21,508.000 22,402.000 22,897.000 28,666.000 31,592.000 30,905.000 32.605.000 32,222.000 15,381.000 16,450.000 16,809.000 17,339.000 17,898.000 21,874.000 23.337.000 22,520.000 24,029.000 24,466.000 4,665.000 5,131.000 4,699.000 5,063.000 4,999.000 6,792.000 8,255.000 8,385.000 8,576.000 7,756.000 1,030.000 1,086.000 1,166.000 1,283.000 1,316.000 1,742.000 1,718.000 1,654.000 1,770.000 2,038.000 3,635.000 4,045.000 3,533.000 3,780.000 3,683.000 5,050.000 6,537.000 6,731.000 6,806.000 5,718.000 97.000 81.000 76.000 172.000 162.000 506.000 596.000 693.000 616.000 704.000 12.000 10.000 9.000 471.000 1,008.000 1,024.000 -180.000 132.000 278.000 420.000 -177.000 320.000 -90.000 -184.000 -972.000 -233.000 -573.000 -1,309.000 -439.000 -884.000 3,373.000 4,294.000 3,376.000 3,895.000 3,557.000 5,335.000 4,861.000 6,029.000 4,550.000 1,282.000 1,580.000 1,249.000 1,445.000 1,056.000 5,188.000 997.000 18.000 998.000 1,526.000 99.000 588.000 760.000 23.000 4,078.000 7.000 59.000 4,220.000 -20.000 2,091.000 2,714.000 2,127.000 2,450.000 1,932.000 4,173.000 5,024.000 3,982.000 .000 .000 .000 .000 .000 .000 .000 .000 .000 .000 .000 .000 .000 .000 .000 .000 .000 .000 .000 .000 2,091.000 2,714.000 2,091.000 .000 2,714.000 .000 2,127.000 2,127.000 .000 2,450.000 2,450.000 .000 1,932.000 1,932.000 .000 4,220.000 4,220.000 .000 4,173.000 4,173.000 .000 4,078.000 4,078.000 .000 5,024.000 5,024.000 .000 3,982.000 3,982.000 .000 2,091.000 3,982.000 2,714.000 .000 2,127.000 .000 2,450.000 .000 1,932.000 .000 4,220.000 .000 4,173.000 .000 4,078.000 .000 5,024.000 .000 .000 .000 2.091.000 2,714.000 2.127.000 2,450.000 1,932.000 4,220.000 4,173.000 4,078.000 5,024.000 3.982,000 2.130 2.970 2.430 2.590 2.030 4.050 3.850 3.800 5.070 4.320 2.130 2.970 2.430 2.590 2.030 4.050 3.850 3.800 5.070 4.320 2.120 2.940 2.420 2.560 2.000 4.000 3.820 3.780 5.050 4.310 Cost of Goods Sold Gross Profit Selling, General, & Admin Expenses Operating Income Before Depreciation Depreciation, Depletion, & Amortiz Operating Income After Depreciation Interest Expense Non-Operating Income Expense Special Items Pretax Income Income Taxes - Total Minority Interest Income Before EI&DO Extraordinary Items Discontinued Operations Net Income (Loss) Income Before EI&DO Preferred Dividends Available for Common Before EI&DO Common Stock Equivalents - Savings Adjusted Available for Common EARNINGS PER SHARE EPS - Primary, Excluding EI&DO EPS - Primary, Including EI&DO EPS -Fully Diluted, Excluding EI&DO COMMON SHARES Common Shares for Primary EPS Calculation 1,043.200 1,083.100 1,073.500 Common Shares for Fully Diluted EPS Calc. 1,053.900 1,091.100 1,078.500 Common Shares Outstanding at Fiscal Yr End 1,089.910 1,082.987 1,023.849 STATEMENT OF RETAINED EARNINGS Fiscal Year: 2010 2011 2012 2013 2014 2015 2016 2017 2018 2019 2020 (N/A (FYR Ending): Retained Rearnings - Beginning Balance (31AUG2010) (31AUG2011) (31AUG2012) (31AUG2013) (31AUG2014) (31AUG2015) (31AUG2016) (31AUG2017) (31AUG2018) (31AUG2019) ) 24,873.000 24,691.000 27,086.000 4,173.000 4,078.000 5,024.000 1,563.000 1,723.000 30,549.000 15,224.000 16,737.000 2,091.000 Net Income 2,714.000 18,859.000 20,205.000 21,414.000 22,402.000 1,932.000 4,220.000 1.199.000 1,384.000 3.982.000 2,127.000 787.000 2,450.000 1,040.000 Cash Dividends 541.000 647.000 1,739.000 1,643.000 Retained Earnings After Dividends 16,774.000 18,804.000 20,199.000 21,615.000 22,147.000 25,238.000 27,483.000 27,046.000 30,371.000 32,888.000 Change - Foreign Currency Translation Adj. to Long-Term Marketable Securities .000 .000 .000 1.000 107.000 2.000 .000 .000 .000 Other CMP Adj. (Stock Splits/Retirement) -111.000 -18.000 49.000 -7.000 -117.000 259.000 -13.000 -352.000 74.000 -14.000 Non-Compustat Adjustments -251.000 -2,541.000 -174.000 214.000 Plug Calculation) 74.000 73.000 -43.000 -194.000 372.000 104.000 -956.000 Retained Earnings - Ending Balance 16,737.000 18,859.000 20,205.000 21,414.000 22,402.000 24,873.000 24,691.000 27,086.000 30,549.000 31.918.000 Retroactive Adjustments (Acct'g Chgs) .000 .000 .000 .000 .000 .000 .000 .000 .000 .000 Retained Earnings - After Adjustments 16,737.000 18,859.000 20,205.000 21,414.000 22,402.000 24,873.000 24,691.000 27,086.000 30,549.000 31,918.000 981.700 987.900 938.605 915.100 924.500 889.294 874.700 880.100 944.055 946.000 955.200 946.596 953.100 965.200 950.387 991.000 995.000 952.133 921.500 923.500 895.388 STATEMENT OF CASH FLOWS Fiscal Year: 2010 2011 2012 2013 2014 2015 2016 2017 2018 2019 2020 (N/A (FYR Ending): (31AUG2010) (31AUG2011) (31AUG2012) (31AUG2013) (31AUG2014) (31AUG2015) (31AUG2016) (31AUG2017) (31AUG2018) (31AUG2019) ) 2,091.000 1,030.000 2,714.000 1,086.000 2,127.000 1,166.000 2,450.000 1,283.000 2,031.000 1,316.000 4,279.000 1,742.000 4,191.000 1.718.000 4,101.000 1,654.000 5,031.000 1,770.000 3,962.000 2,038.000 .000 63.000 .000 132.000 .000 265.000 .000 148.000 -344.000 .000 177.000 -617.000 .000 -32.000 -315.000 .000 -442.000 -81.000 .000 -434.000 -143.000 .000 -322.000 -581.000 .000 100.000 -187.000 .000 .000 .000 -434.000 .000 142.000 .000 97.000 .000 776.000 .000 -505.000 .000 779.000 .000 455.000 .000 426.000 .000 421.000 144.000 188.000 124.000 -243.000 394.000 -449.000 -338.000 115.000 -391.000 -789.000 -616.000 860.000 -153.000 98.000 -307.000 -592.000 1,083.000 321.000 719.000 -644.000 331.000 141.000 1,690.000 10.000 102.000 -228.000 103.000 17.000 -335.000 202.000 44.000 694.000 -406.000 589.000 690.000 -518.000 692.000 -51.000 449.000 2,009.000 -61.000 1,307.000 314.000 3,744.000 3,643.000 4,431.000 4,301.000 3,893.000 5,664.000 7,847.000 7,251.000 8.265.000 5,594.000 INDIRECT OPERATING ACTIVITIES Income Before Extraordinary Items Depreciation and Amortizations Extraordinary Items and Disc. Operations Deferred Taxes Equity in Net Loss (Earnings) Sale of PPEq and Investments - Loss (Gain) Funds from Operations - Other Receivables - Decrease (Increase) Inventory - Decrease (Increase) Accounts/P and Accrued Liabs - Inc(Dec) Income Taxes - Accrued - Increase(Decrease) Other Assets and Liabilities - Net Change Operating Actiities - Net Cash Flow INVESTING ACTIVITIES Investments - Increase Sale of Investments Short term Investments - Change Capital Expenditures Sale of Property Plant and Equipment Acquisitions Investing Activities - Other Investing Activites - Net Cash Flow FINANCING ACTIVITIES Sale of Common and Preferred Stock Purchase of Common and Preferred Stock Cash Dividends Long Term Debt - Issuance Long Term Debt - Reduction Current Debt Changes Financing Activities - Other Financing Activities - Net Cash Flow Exchange Rate Effect Cash and Cash Equivalents - Change OTHER INFORMATION Interest Paid - Net< Income Taxes Paid .000 .000 500.000 1,014.000 -760.000 -1,274.000 233.000 1,756.000 541.000 .000 576.000 -37.000 -2,677.000 .000 -207.000 89.000 1,195.000 .000 .000 .000 1,213.000 -312.000 -1,525.000 235.000 2,028.000 647.000 .000 17.000 15.000 -2,442.000 .000 -324.000 89.000 1,320.000 4,025.000 224.000 493.000 .000 .000 .000 .000 -50.000 1,212.000 -1.000 1,106.000 1.550.000 -285.000 -510.000 -131.000 -5,860.000 -1,996.000 -1,731.000 165.000 486.000 612.000 1,191.000 615.000 705.000 1,199.000 787.000 1,040.000 3,000.000 .000 4,000.000 4,300.000 268.000 550.000 -17.000 -27.000 -48.000 1,170.000 -1,496.000 -1,622.000 .000 .000 .000 -259.000 809.000 540.000 108.000 158.000 161.000 1,203.000 1,200.000 1,200.000 .000 .000 1.000 1.251.000 867.000 4,832.000 939.000 -4,276.000 503.000 1,226.000 1,384.000 12,285.000 10,472.000 -226.000 -395.000 -915.000 -119.000 354.000 472.000 1,300.000 2,360.000 .000 .000 .000 .000 1.325.000 1,351.000 60.000 126.000 444.000 88.000 234.000 152.000 -3,517.000 -843.000 235.000 217.000 1,152.000 1,563.000 5,220.000 1,723.000 .000 6,196.000 5,991.000 791.000 33.000 29.000 -143.000 -45.000 2,606.000 -12,934.000 -129.000 20.000 6,807.000 -6.506.000 580.000 643.000 1,100.000 1,100.000 .000 .000 .000 .000 .000 .000 1,367.000 1,702.000 4,793.000 659.000 3.000 741.000 133.000 -5,501.000 -2,307.000 174.000 174.000 5.228.000 4,160.000 1,739.000 1,643.000 12,433.000 5.900.000 4,890.000 10,461.000 586.000 536.000 -98.000 75.000 -5,295.000 -3,046.000 15.000 -9.000 -2,516.000 232.000 577.000 676.000 600.000 900.000
Expert Answer:
Answer rating: 100% (QA)
Inventory Turnover Ratio Sales Inventory 1 LIFO method Sales Closing Stock 2 FIFO method Sales Opening Stock 3 Current Cost Sales Average Inventory Al... View the full answer

Related Book For 

Applied Equity Analysis and Portfolio Management Tools to Analyze and Manage Your Stock Portfolio
ISBN: 978-1118630914
1st edition
Authors: Robert A.Weigand
Posted Date:
Students also viewed these accounting questions
-
USING 2018 CONSOLIDATE STATEMENT OF FINANCIAL POSITION AND NOTES TO CONSOLIDATED FINANCIAL STATEMENTS FROM THE ANNUAL REPORT OF ADIDAS COMPANY, PLEASE ANSWER THE FOLLOWING QUESTIONS. ACCOUNTS...
-
Calculate UTX's days sales outstanding and inventory turnover ratio s for each year 2010-2012.
-
Statement of Financial Position Preparation Presented below are a number of statement of financial position items for Montoya. Inc., for the current year, 2010. Instructions Prepare a classified...
-
Austin Limited is trying to determine the value of its ending inventory as of February 28, 2019, the companys year-end. The following transactions occurred, and the accountant asked your help in...
-
Refer to Data Set 12 in Appendix B. Construct a box plot for the 50 digits from the Lotto 6/49 bonus draw. Compare the shape of the resulting box plot to the generic shapes. Based on the box plot, do...
-
Rocco operates a beauty salon as a sole proprietorship. Rocco also owns and rents an apartment building. In 2 0 2 3 , Rocco had the following income and expenses. You may assume that Rocco will owe $...
-
What lump-sum amount of interest will be paid on a \($10,000\) loan that was made on 1 June 2011 and repaid on 1 September 2015, with ordinary simple interest at 10% per year?
-
Bath concentrations are measured hourly in a chemical process. Data (in ppm) for the last 32 hours are shown in Table 9E.4 (read down from left). The process target is µ0 = 175 ppm. (a)...
-
Marketing Analytics 6.1 The Expanding Uses of Data Mining and Analytics in the Restaurant Industry** When Damian Mogavero, a restaurant group CFO, realized the vast need for improved data analytics...
-
1. a. How much did the materials cost per unit change between June and July? b. How much did the conversion cost per unit change between June and July? 2. Which is the optimal choice of material and...
-
Suppose that the long-run total cost function for the typical mushroom producer is given by: TC=wq2 -10q+100 Where q represents the output of the typical firm and w represents the hourly wage rate...
-
How is racial discrimination against Aboriginal peoples in Australia related to their dispossession from their lands and white possession?
-
The Ministry of Health ('MOH') is responsible for processing payments to various parties. On occasion, MOH receives notifications which require deductions to be made from payments for certain...
-
Boeing just signed a contract to sell a Boeing 737 aircraft to Air France. Air France will be billed 20 million which is payable in 3 months' time. The following information is available to you: Spot...
-
What impact do reproductive technologies have on social parents in society? explain
-
What programs and policies show promise to lift countries out of extreme poverty? Explain.
-
How do technological advancements, such as surveillance technologies, artificial intelligence, and algorithmic decision-making systems, reshape the dynamics of authority and control in contemporary...
-
Determine the volume of the parallelepiped of Fig. 3.25 when (a) P = 4i 3j + 2k, Q = 2i 5j + k, and S = 7i + j k, (b) P = 5i j + 6k, Q = 2i + 3j + k, and S = 3i 2j + 4k. P
-
Describe the importance of a "catalyst" in the context of fundamental analysis.
-
Calculate UTX's net operating profit after tax (NOPAT) for each year 2010-2012.
-
Before performing any calculations, do you think that Deere and Intel would be good stocks to combine into a portfolio? (Explain.)
-
Consider expansion of a function in terms of a series \(F_{n}(x)\) in the following form: \[f(x)=\sum_{n} A_{n} F_{n}(x)\] If the functions \(F_{n}\) are orthogonal then this property helps to unfold...
-
A concrete wall \(20 \mathrm{~cm}\) thick is initially at a temperature of \(20^{\circ} \mathrm{C}\), and is exposed to steam at pressure \(1 \mathrm{~atm}\) on both sides. Find the time for the...
-
Analyze the transient problem with the Dirichlet condition for a long cylinder and for a sphere. Derive expressions for the eigenfunctions, eigenconditions, and eigenvalues. Find the series...

Study smarter with the SolutionInn App