

This part would help you to reinforce your understanding of the Little's Law. We have a...
Fantastic news! We've Found the answer you've been seeking!
Question:
Transcribed Image Text:
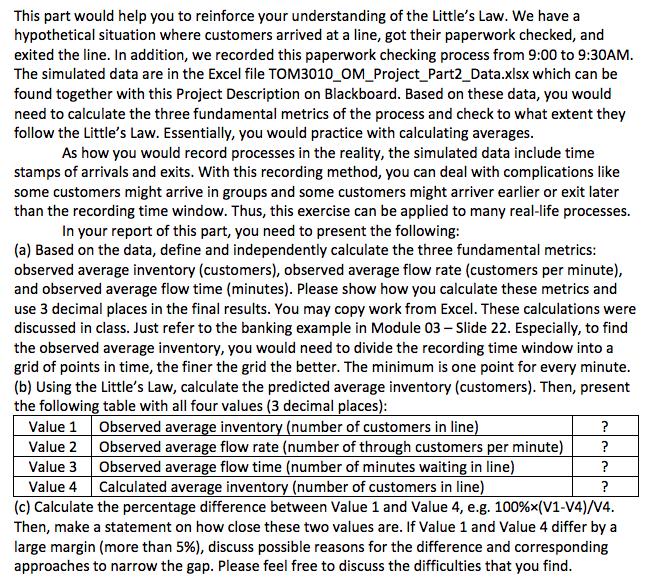
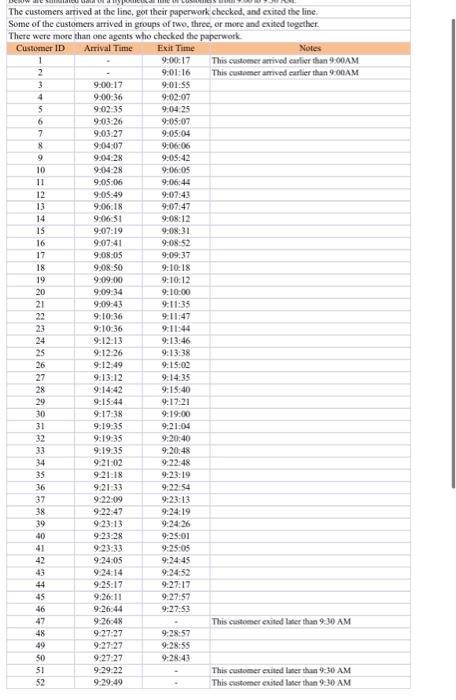
This part would help you to reinforce your understanding of the Little's Law. We have a hypothetical situation where customers arrived at a line, got their paperwork checked, and exited the line. In addition, we recorded this paperwork checking process from 9:00 to 9:30AM. The simulated data are in the Excel file TOM3010_OM_Project_Part2 Data.xlsx which can be found together with this Project Description on Blackboard. Based on these data, you would need to calculate the three fundamental metrics of the process and check to what extent they follow the Little's Law. Essentially, you would practice with calculating averages. As how you would record processes in the reality, the simulated data include time stamps of arrivals and exits. With this recording method, you can deal with complications like some customers might arrive in groups and some customers might arriver earlier or exit later than the recording time window. Thus, this exercise can be applied to many real-life processes. In your report of this part, you need to present the following: (a) Based on the data, define and independently calculate the three fundamental metrics: observed average inventory (customers), observed average flow rate (customers per minute), and observed average flow time (minutes). Please show how you calculate these metrics and use 3 decimal places in the final results. You may copy work from Excel. These calculations were discussed in class. Just refer to the banking example in Module 03 – Slide 22. Especially, to find the observed average inventory, you would need to divide the recording time window into a grid of points in time, the finer the grid the better. The minimum is one point for every minute. (b) Using the Little's Law, calculate the predicted average inventory (customers). Then, present the following table with all four values (3 decimal places): Observed average inventory (number of customers in line) Observed average flow rate (number of through customers per minute) Value 3 Observed average flow time (number of minutes waiting in line) Value 1 Value 2 ? ? Value 4 Calculated average inventory (number of customers in line) ? (c) Calculate the percentage difference between Value 1 and Value 4, e.g. 100%x(V1-V4)/V4. Then, make a statement on how close these two values are. If Value 1 and Value 4 differ by a large margin (more than 5%), discuss possible reasons for the difference and corresponding approaches to narrow the gap. Please feel free to discuss the difficulties that you find. The customers arrived at the line, got their paperwork checked, and exited the line. Some of the customers arrived in groups of two, three, or more and exited together. There were more than one agents who checked the paperwork Customer ID Arrival Time Exit Time Notes 9:00:17 This customer arrived carlier than 9:00OAM 9:01:16 This customer amived carlier than 9:00AM 9:01:55 9:02:07 3. 9:00:17 4 9:00:36 9:02:35 9:04:25 9:03:26 9:05:07 7. 9.03:27 9:05:04 9:0407 9:06:06 9:05:42 9:06:05 9.04:28 10 9:04:28 11 9:05:06 9:06:44 12 9:05:49 9:07:43 13 9:06:18 9:07:47 14 9:06:51 9:08:12 15 9:07:19 9:08:31 16 9:07:41 9:08:52 17 9,08:05 9:09:37 18 9:08:50 9:10:18 19 9:09:00 9:10:12 20 9:09 34 9:10:00 21 9:09 43 9:11:35 22 9:10:36 9:11:47 9:11:44 9:13:46 23 9:10:36 24 9:12:13 25 9:12:26 9:13:38 26 9:12:49 9:15:02 27 9:13:12 9:14:35 28 9:14:42 9:15:40 29 9:15:44 9:17:21 30 9:17:38 9:19:00 31 9:19:35 9:21:04 32 9:19:35 9:20:40 33 9:19.35 9:20:48 34 9:21:02 9:22:48 35 9:21:18 9:23:19 36 9:21:33 9:22:54 37 9:22:09 9:22:47 9:23:13 38 9:24:19 39 9:23:13 9:24:26 40 9:23:28 9:25:01 41 9:23:33 9:25:05 42 9:24:05 9:24:45 43 9:24:14 9:24:52 44 9:25:17 9:27:17 45 9:26:11 9:27:57 46 9:26:44 9:27:53 47 9:26:48 This customer exited later than 9:30 AM 48 9:27:27 9:28:57 49 9:27:27 9:28:55 50 9:27:27 9:28:43 51 9:29:22 This customer exited later than 9:30 AM 52 9:29 49 This customer exited later than 9:30 AM This part would help you to reinforce your understanding of the Little's Law. We have a hypothetical situation where customers arrived at a line, got their paperwork checked, and exited the line. In addition, we recorded this paperwork checking process from 9:00 to 9:30AM. The simulated data are in the Excel file TOM3010_OM_Project_Part2 Data.xlsx which can be found together with this Project Description on Blackboard. Based on these data, you would need to calculate the three fundamental metrics of the process and check to what extent they follow the Little's Law. Essentially, you would practice with calculating averages. As how you would record processes in the reality, the simulated data include time stamps of arrivals and exits. With this recording method, you can deal with complications like some customers might arrive in groups and some customers might arriver earlier or exit later than the recording time window. Thus, this exercise can be applied to many real-life processes. In your report of this part, you need to present the following: (a) Based on the data, define and independently calculate the three fundamental metrics: observed average inventory (customers), observed average flow rate (customers per minute), and observed average flow time (minutes). Please show how you calculate these metrics and use 3 decimal places in the final results. You may copy work from Excel. These calculations were discussed in class. Just refer to the banking example in Module 03 – Slide 22. Especially, to find the observed average inventory, you would need to divide the recording time window into a grid of points in time, the finer the grid the better. The minimum is one point for every minute. (b) Using the Little's Law, calculate the predicted average inventory (customers). Then, present the following table with all four values (3 decimal places): Observed average inventory (number of customers in line) Observed average flow rate (number of through customers per minute) Value 3 Observed average flow time (number of minutes waiting in line) Value 1 Value 2 ? ? Value 4 Calculated average inventory (number of customers in line) ? (c) Calculate the percentage difference between Value 1 and Value 4, e.g. 100%x(V1-V4)/V4. Then, make a statement on how close these two values are. If Value 1 and Value 4 differ by a large margin (more than 5%), discuss possible reasons for the difference and corresponding approaches to narrow the gap. Please feel free to discuss the difficulties that you find. The customers arrived at the line, got their paperwork checked, and exited the line. Some of the customers arrived in groups of two, three, or more and exited together. There were more than one agents who checked the paperwork Customer ID Arrival Time Exit Time Notes 9:00:17 This customer arrived carlier than 9:00OAM 9:01:16 This customer amived carlier than 9:00AM 9:01:55 9:02:07 3. 9:00:17 4 9:00:36 9:02:35 9:04:25 9:03:26 9:05:07 7. 9.03:27 9:05:04 9:0407 9:06:06 9:05:42 9:06:05 9.04:28 10 9:04:28 11 9:05:06 9:06:44 12 9:05:49 9:07:43 13 9:06:18 9:07:47 14 9:06:51 9:08:12 15 9:07:19 9:08:31 16 9:07:41 9:08:52 17 9,08:05 9:09:37 18 9:08:50 9:10:18 19 9:09:00 9:10:12 20 9:09 34 9:10:00 21 9:09 43 9:11:35 22 9:10:36 9:11:47 9:11:44 9:13:46 23 9:10:36 24 9:12:13 25 9:12:26 9:13:38 26 9:12:49 9:15:02 27 9:13:12 9:14:35 28 9:14:42 9:15:40 29 9:15:44 9:17:21 30 9:17:38 9:19:00 31 9:19:35 9:21:04 32 9:19:35 9:20:40 33 9:19.35 9:20:48 34 9:21:02 9:22:48 35 9:21:18 9:23:19 36 9:21:33 9:22:54 37 9:22:09 9:22:47 9:23:13 38 9:24:19 39 9:23:13 9:24:26 40 9:23:28 9:25:01 41 9:23:33 9:25:05 42 9:24:05 9:24:45 43 9:24:14 9:24:52 44 9:25:17 9:27:17 45 9:26:11 9:27:57 46 9:26:44 9:27:53 47 9:26:48 This customer exited later than 9:30 AM 48 9:27:27 9:28:57 49 9:27:27 9:28:55 50 9:27:27 9:28:43 51 9:29:22 This customer exited later than 9:30 AM 52 9:29 49 This customer exited later than 9:30 AM
Expert Answer:
Answer rating: 100% (QA)
a Then for every minute you calculate the difference between the number of customers who arrived and the number of customers who exited The values of ... View the full answer

Related Book For 

Posted Date:
Students also viewed these accounting questions
-
This problem is designed to reinforce your understanding of the simplex feasibility condition. In the first tableau in Example 3.3-1, we used the minimum (nonnegative) ratio test to determine the...
-
To show your understanding of the WARN notice, answer these questions: (a) Who are the covered employers? (b) What format is required for a WARN notice? (c) When must the WARN notice be given? (d) To...
-
This exercise tests your understanding of the four inventory methods. List the name of the inventory method that best fits the description. Assume that the cost of inventory is rising. 1....
-
One of Red Clay's employee handbook sections covers employee monitoring. An employee filed a complaint with the HR department stating he opposes this monitoring and chooses to opt out. What legal...
-
Compare the four categories of e-business models.
-
Millar, Inc., purchased a truck to use for deliveries and is attempting to determine how much depreciation expense would be recognized under three different methods. The truck cost $20,000 and is...
-
Suppose that a probability of \(\frac{1}{16}\) is assigned to each point of the sample space of part (a) of Exercise 3.1 on page 65 . Find the probability distribution of the total number of units of...
-
Consider an infinitely long continuous string with linear mass density p1 for x < 0 and for x > L, but density p2 > p1 for 0 < x < L. If a wave train oscillating with an angular frequency w is...
-
Question: L MAX (X.XXXXX)L MIN (X.XXXXX)AM MAX (X.XXXXX)AM MIN (X.XXXXX)A L MAX ( X . XXXXX ) L MIN ( X . XXXXX ) AM MAX ( X . XXXXX ) AM MIN ( X . XXXXX ) A L MAX (X.XXXXX) L MIN (X.XXXXX) M MAX...
-
7 8 9 10 11 12 13 14 15 16 17 18 19 20 21 22 23 24 25 26 27 28 29 30 31 32 33 34 35 30 37 38 39 40 41 42 43 44 45 40 47 48 49 50 51 52 53 54 55 1 In the last 10 years, Victoria has worked for Alberta...
-
Given that the WVTR of Nylon 6 is 10.6 g mil/(100 in2 day) at 37.8C and 90% RH, and that the saturation water vapor pressure at 37.8C is 49.09 mm Hg, what is the minimum thickness of Nylon 6 required...
-
Lisinipril is a drug designed to lower blood pressure. In a clinical trial of Lisinipril, blood pressure levels of subjects are measured before and after they have been treated with the drug....
-
Identifying the Population In a Gallup poll of 1010 adults in the United States, 55% of the respondents said that they used local TV stations daily as a source of news. Is the 1010 value a statistic...
-
According to the State of New York Unified Court System, names of potential jurors are selected from a variety of different sources. When a trial requires a jury, names from the list are randomly...
-
Years in which U.S. presidents were inaugurated. Determine which of the four levels of measurement (nominal, ordinal, interval, ratio) is most appropriate.
-
When collecting data from different sample locations in a lake, a researcher uses the line transect method by stretching a rope across the lake and collecting samples at every interval of 5 meters....
-
Example however if possible to help with Calgary, Alberta Exhibit 2.6 A Perceptual Map for New Orleans Tourist Attractions IV River Cruise E Relaxing Cemetery Visit Knowledge Seekers Relaxers Jazz...
-
Write a paper about the Working relationship in the organization- collaboration within and outside the organization
-
Solve the following LP in three different ways (use TORA for convenience). Which method appears to be the most efficient computationally? Minimize z = 6x1 + 7x2 + 3x3 + 5x4 Subject to 5x1 + 6x2 - 3x3...
-
Show that the 100% feasibility rule in Problem 12, Set 3.6c (Chapter 3) is based on the condition Optimum) orginal right-hand inverse side vector
-
An eccentric sheikh left a will to distribute a herd of camels among his three children: Tarek receives at least one-half of the herd, Sharif gets at least one third, and Maisa gets at least...
-
Understanding the Feds actions that are needed to stabilize the interest rate The diagram below shows three different money demand curves and a target interest rate i*. Fill in the table below using...
-
This section looks at US recessions over the past 60 years. To work out this problem, first obtain quarterly data on US output growth for the period 1960 to the most recent data from www.bea.gov....
-
This question asks you to examine the movements of investment and consumption before, during and after the recession of 2001. It also asks you to consider the response of investment and consumption...

Study smarter with the SolutionInn App