

Plastique Ltd., established in 1970, is a manufacturer of plastic products. Starting from a small, family-run business
Question:
Plastique Ltd., established in 1970, is a manufacturer of plastic products. Starting from a small, family-run business with a small core team, it has grown into a well-known household name. The company’s financial statements showed revenue of INR 200 Crores for its three business units. Plastique Ltd. produces 120 product groups, with 600 end products. It offers 3 brands in eight market segments. It acts as a raw input provider for a multitude of industries ranging from retail and healthcare to automotive parts.
Because of the scale of the operations, the company has set up three in-house plants, with the total annual production capacity amounting to 150 million kgs per annum. The plants operate for 25 days per month or 300 days per annum. The table below provides the distribution of plant capacities and the number of types of products each plant produces.
Plant | P1 | P2 | P3 | Total |
| Number of types of products | 200 | 225 | 175 | 600 |
| Production Capacity | 45 | 55 | 50 | 150 |
Furthermore, each plant has 12 operations associated with the production -process. These can be considered as the 12 work centres. Each plant has a set of 12 operations that relate to the specific products being produced at the plant. For example, if P1 produces mugs, then only P1 can produce mugs. In case P1 is inoperational, the production of mugs halts.
Mr Sunil, the CEO of Plastique Ltd., has asked the operations manager to provide a forecast of the demand for the upcoming fiscal year for the products produced by P2. The forecast is detailed in the file attached to the link provided below.
Forecast Data
In case you are not able to open the link, the same file is attached at the bottom of this page for you to download.
The first tab of the sheet of the file contains details of the company’s performance and the accuracy of the forecast for the last 3 months of the financial year 2019-2020. The second part of the table details the plant’s plan for production, along with the capacity and the demand forecast data generated by the demand planner.
The second tab of the sheet of the file provides details on the sales for the previous fiscal year and maps it to the demand forecast.
Due to internal recalibrations, Mr Sunil has hired you, an operational consultant, to verify the calculated metrics. The brief provided by Mr Sunil is mentioned below.
Project Objectives
- Evaluate the frameworks used in planning and analysing operations of a manufacturing plant at Plastique Ltd.
- Decide the courses of action needed to improve operations at Plastique Ltd.
Based on the objectives mentioned by Mr Sunil, your team comes up with the following action items:
- Generate demand forecast for the upcoming fiscal year.
- Compare the generated forecast to the pre-calculate demand forecast by the demand planner.
- Judge if the current capacity of P2 could meet the demand.
- Calculate the aggregate demand monthly Closing Inventory (CI) and Production Plan (PP).
Production Data:
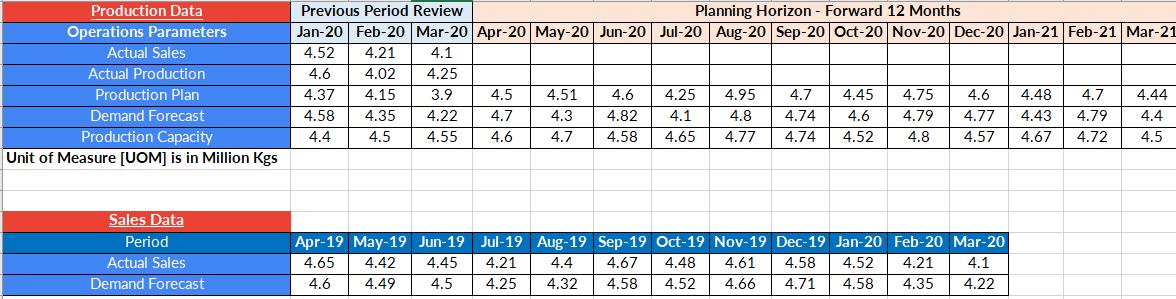
- Based on the sales data in the second tab of the sheet (Sales data) for the period Apr-19 to Mar-20, you are required to generate the forecast for the next 12 months period (Apr-20 to Mar-21) using suitable techniques and compute the corresponding forecast error metrics.
- Based on the above, which technique is more reliable and why? How effective are your forecasted figures compared with those of the demand planning team as shown in the first sheet (Production Data)?
- Is the aggregate production capacity in P2 sufficient to meet the expected future demand? Would there be a need for contract manufacturing (outsourcing) in the future?
- Can you calculate the aggregate monthly Closing Inventory (CI) and Production Plan (PP) based on the following inputs? What is the impact on CI and PP if the Safety Stock (SS) level is altered, i.e., increased by 3%?
- Safety Stock (SS) = 30% of the Monthly Demand Forecast (DF)
- Production Plan (PP) = Demand Forecast (DF) + Safety Stock (SS) - Opening Inventory (OI)
- Closing Inventory (CI) = Opening Inventory (OI) + Production Plan (PP) - Demand Forecast (DF)
- Consider 'Opening Inventory (OI)' = 3.1 Million Kgs (At the end of Mar-20)
- Closing Inventory (CI) at the end of month (M) = Opening Inventory at the start of month (M+1)
- Calculation Period = Apr-20 to Sep-20 (6 Months)
Expert Answer:
the school selfevaluation committees of secondary faculties this is often associate innovation the m... View the full answer


Fundamentals of Cost Accounting
ISBN: 978-1259565403
5th edition
Authors: William Lanen, Shannon Anderson, Michael Maher
