Suppose the market for pizza is a perfectly competitive marketthat is, sellers take the market price as
Question:
Suppose the market for pizza is a perfectly competitive market—that is, sellers take the market price as given. Sean owns a restaurant where he sells pizza. The following graph shows Sean's weekly supply curve, represented by the orange line. Point A represents a point along his supply curve. The price of pizza is $3.00 per slice, as shown by the horizontal black line.
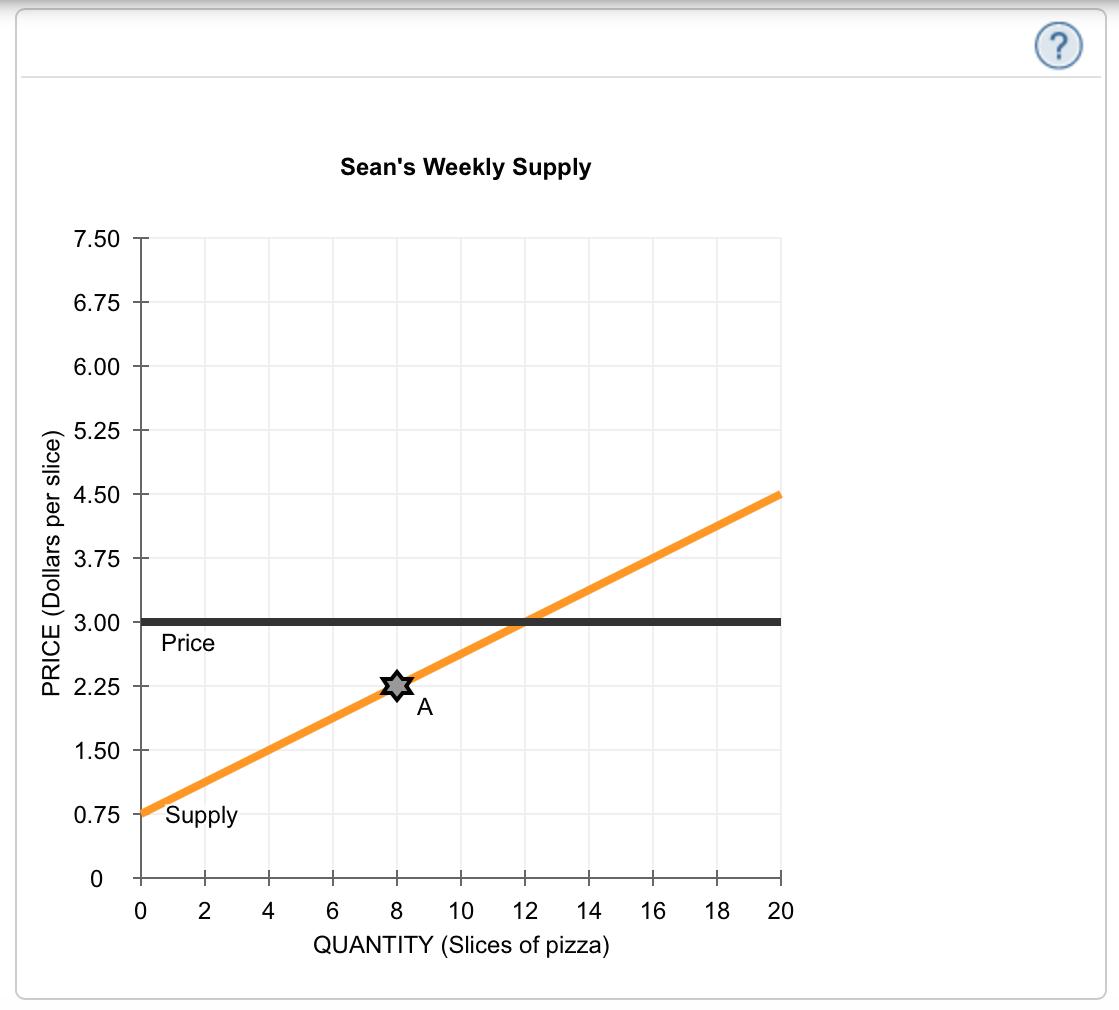
From the previous graph, you can tell that Sean is willing to supply his 8th slice of pizza for ($ ) each week. Since he receives $3.00 per slice, the producer surplus he gains from supplying the 8th slice of pizza is ($ ).
Suppose the price of pizza were to rise to $3.75 per slice. At this higher price, Sean would receive a producer surplus of ($ ) from the 8th slice of pizza he sells.
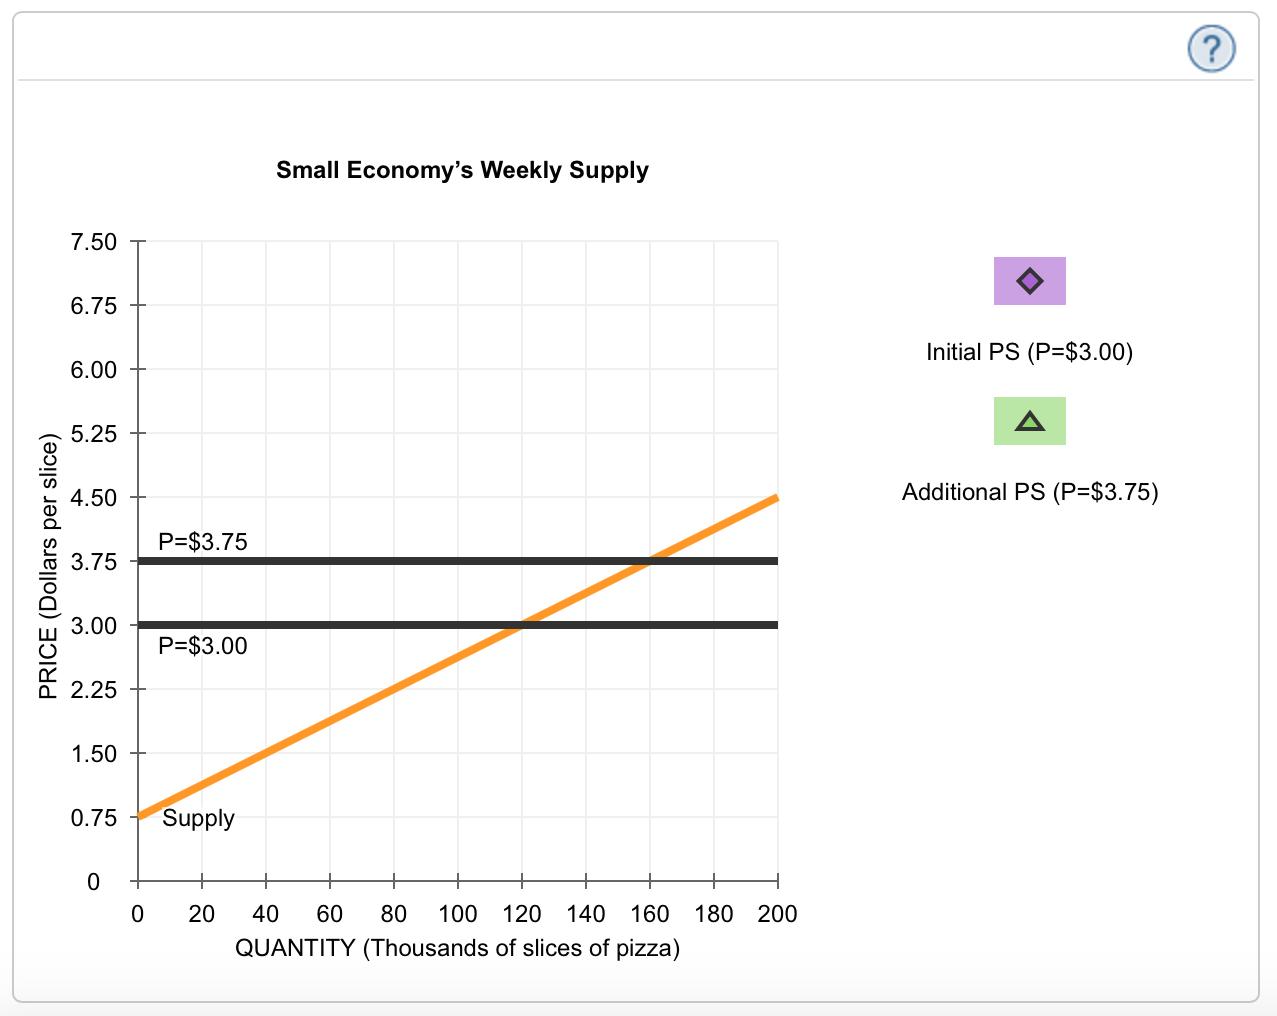
The following graph shows the weekly market supply of pizza in a small economy.
Use the purple point (diamond symbol) to shade the area representing producer surplus (PS) when the price (P) of pizza is $3.00 per slice. Then, use the green point (triangle symbol) to shade the area representing additional producer surplus when the price rises to $3.75 per slice.
Expert Answer: