

It is believed that the average number of hours spent studying per day (HOURS) during undergraduate...
Fantastic news! We've Found the answer you've been seeking!
Question:
Transcribed Image Text:
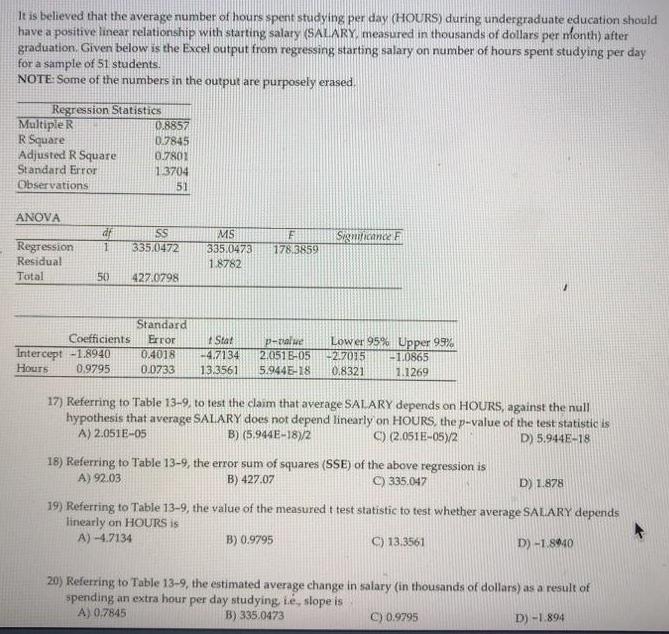
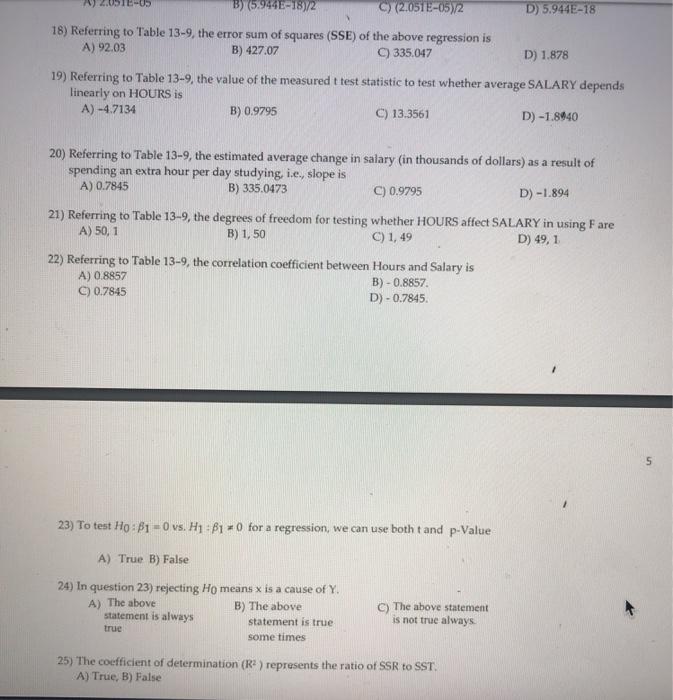
It is believed that the average number of hours spent studying per day (HOURS) during undergraduate cducation should have a positive linear relationship with starting salary (SALARY. measured in thousands of dollars per month) after graduation. Given below is the Excel output from regressing starting salary on number of hours spent studying per day for a sample of 51 students. NOTE Some of the numbers in the output are purposely erased. Regression Statistics Multipie R RSquare Adjusted R Square Standard Error Observations 0.8857 0.7845 0.7801 1.3704 51 ANOVA df 335.0472 SS MS Sigmicance E Regression Residua! 335.0473 178 3859 18782 Total 50 427.0798 Coefficients Intercept -1.8940 0,9795 Standard Error 0.4018 t Stat -4.7134 p-talue 2.0516-05 5.944E-18 Lower 95% Upper 99% 2.7015 0.8321 -10865 Hours 0.0733 13.3561 1.1269 17) Referring to Table 13-9, to test the claim that average SALARY depends on HOURS, against the null hypothesis that average SALARY does not depend linearly on HOURS, the p-value of the test statistic is A) 2.051E-05 B) (5,944E-18)/2 C) (2.051E-05)/2 D) 5.944E-18 18) Referring to Table 13-9, the error sum of squares (SSE) of the above regression is A) 92.03 B) 427.07 C) 335.047 D) 1.878 19) Referring to Table 13-9, the value of the measured t test statistic to test whether average SALARY depends linearly on HOURS is A) -4.7134 B) 0.9795 C) 13.3561 D) -1.8940 20) Referring to Table 13-9, the estimated average change in salary (in thousands of dollars) as a result of spending an extra hour per day studying Le, slope is A) 0.7845 B) 335.0473 C) 0.9795 D) -1.894 B) (5.944E-18)/2 2.051E-0 C) (2.051E-05)2 D) 5.944E-18 18) Referring to Table 13-9, the error sum of squares (SSE) of the above regression is A) 92.03 B) 427.07 C) 335.047 D) 1.878 19) Referring to Table 13-9, the value of the measured t test statistic to test whether average SALARY depends linearly on HOURS is A) -4.7134 B) 0.9795 C) 13.3561 D) -1.8440 20) Referring to Table 13-9, the estimated average change in salary (in thousands of dollars) as a result of spending an extra hour per day studying, i.e, slope is A) 0.7845 B) 335.0473 C) 0.9795 D) -1.894 21) Referring to Table 13-9, the degrees of freedom for testing whether HOURS affect SALARY in using F are A) 50, 1 B) 1, 50 C) 1, 49 D) 49, 1 22) Referring to Table 13-9, the correlation coefficient between Hours and Salary is A) 0.8857 C) 0.7845 B) - 0.8857. D) - 0.7845. 23) To test Ho : B1 -0 vs. H1 : B1 =0 for a regression, we can use both t and p-Value A) True B) False 24) In question 23) rejecting Ho means x is a cause of Y. A) The above statement is always B) The above C) The above statement is not true always statement is true true some times 25) The coefficient of determination (R) represents the ratio of SSR to SST. A) True, B) False It is believed that the average number of hours spent studying per day (HOURS) during undergraduate cducation should have a positive linear relationship with starting salary (SALARY. measured in thousands of dollars per month) after graduation. Given below is the Excel output from regressing starting salary on number of hours spent studying per day for a sample of 51 students. NOTE Some of the numbers in the output are purposely erased. Regression Statistics Multipie R RSquare Adjusted R Square Standard Error Observations 0.8857 0.7845 0.7801 1.3704 51 ANOVA df 335.0472 SS MS Sigmicance E Regression Residua! 335.0473 178 3859 18782 Total 50 427.0798 Coefficients Intercept -1.8940 0,9795 Standard Error 0.4018 t Stat -4.7134 p-talue 2.0516-05 5.944E-18 Lower 95% Upper 99% 2.7015 0.8321 -10865 Hours 0.0733 13.3561 1.1269 17) Referring to Table 13-9, to test the claim that average SALARY depends on HOURS, against the null hypothesis that average SALARY does not depend linearly on HOURS, the p-value of the test statistic is A) 2.051E-05 B) (5,944E-18)/2 C) (2.051E-05)/2 D) 5.944E-18 18) Referring to Table 13-9, the error sum of squares (SSE) of the above regression is A) 92.03 B) 427.07 C) 335.047 D) 1.878 19) Referring to Table 13-9, the value of the measured t test statistic to test whether average SALARY depends linearly on HOURS is A) -4.7134 B) 0.9795 C) 13.3561 D) -1.8940 20) Referring to Table 13-9, the estimated average change in salary (in thousands of dollars) as a result of spending an extra hour per day studying Le, slope is A) 0.7845 B) 335.0473 C) 0.9795 D) -1.894 B) (5.944E-18)/2 2.051E-0 C) (2.051E-05)2 D) 5.944E-18 18) Referring to Table 13-9, the error sum of squares (SSE) of the above regression is A) 92.03 B) 427.07 C) 335.047 D) 1.878 19) Referring to Table 13-9, the value of the measured t test statistic to test whether average SALARY depends linearly on HOURS is A) -4.7134 B) 0.9795 C) 13.3561 D) -1.8440 20) Referring to Table 13-9, the estimated average change in salary (in thousands of dollars) as a result of spending an extra hour per day studying, i.e, slope is A) 0.7845 B) 335.0473 C) 0.9795 D) -1.894 21) Referring to Table 13-9, the degrees of freedom for testing whether HOURS affect SALARY in using F are A) 50, 1 B) 1, 50 C) 1, 49 D) 49, 1 22) Referring to Table 13-9, the correlation coefficient between Hours and Salary is A) 0.8857 C) 0.7845 B) - 0.8857. D) - 0.7845. 23) To test Ho : B1 -0 vs. H1 : B1 =0 for a regression, we can use both t and p-Value A) True B) False 24) In question 23) rejecting Ho means x is a cause of Y. A) The above statement is always B) The above C) The above statement is not true always statement is true true some times 25) The coefficient of determination (R) represents the ratio of SSR to SST. A) True, B) False
Expert Answer:
Answer rating: 100% (QA)
18 From the table The pvalue of hours 59447 182 19 errors s... View the full answer

Posted Date:
Students also viewed these accounting questions
-
The numbers of hours spent studying per day by a sample of 28 students Use technology to draw a box-and-whisker plot that represents the data set. 2 8 7 2 3 3 3 2 2 7 8 3 5 1 1 2 6 1 5 7 3 8 5 3 3 7...
-
The following data represent the average number of hours per week that a random sample of 40 college students spend online. The data are based on the ECAR Study of Undergraduate Students and...
-
The following data represent the average number of hours per week that a random sample of 40 college students spend online. The data are based on the ECAR Study of Undergraduate Students and...
-
3: Command pattern and a word-processor's Undo and Redo You probably have already used Ctrl+Z (for Undo) and Ctrl+Y (for Redo) in your word processor. What do you think might be a WordProcessor...
-
The following T-accounts summarize the operations of Chen Construction Company for July 2011. Required: 1. Assuming that only one transaction occurred on each day (beginning on July 2) and that no...
-
Account analysis Java Joe Coffees wants to find an equation to estimate monthly utility costs. Java Joes has been in business for one year and has collected the following cost data for utilities:...
-
Refer to E5-31A and E5-32A. Assume the Woodson Dairy Forming Department has the following costs per equivalent unit (EU) on its own production cost report for the month of January: Cost per EU...
-
William E. Story agreed to pay his nephew, William E. Story II, a large sum of money (roughly equivalent to $50,000 in 2007 dollars) if he would refrain from drinking liquor, using tobacco, swearing,...
-
10. A skier plans to ski a smooth fixed hemisphere of radius R. He starts form rest on a curved smooth surface of height TR/4 The angle at which he leaves the hemisphere is : (a) cos Yshipma (b) cos...
-
The following information came from the financial records of Maverick Corporation: Maverick began operations on January 1, 2015. The company has paid the following amounts in cash dividends over the...
-
Prove that BN CP + NR AM MQ Hint: Evaluat AM MQ MA MQ. MA Ng2 BN NR.NB prove that: AM !! M Q (m) the inequa lity. use AM-GM to
-
Identify the different pricing strategies and objectives that influence decisions about pricing products in global markets.
-
What is the difference between a consumer sales promotion and a trade sales promotion? Describe the various types and purposes of using coupons, like free-standing inserts and on-pack coupons.
-
Tea has been in the limelight recently thanks to increasing global demand, especially in emerging economies like China and India. China, India, Kenya, and Sri Lanka are some of the largest producers...
-
Explain the structure of the advertising industry, and describe the difference between agency holding companies and individual agency brands.
-
Explain some of the tactics global companies can use to combat the problem of gray market goods.
-
Weekly Assignment #2 B Question 10 of 10 View Policies Show Attempt History Current Attempt in Progress (a) A machine that produces cellphone components is purchased on January 1, 2024, for $108,000....
-
Cassandra Casey operates the Futuristic Antique Store. She maintains subsidiary ledgers for accounts payable and accounts receivable. She presents you with the following information for October 2019:...
-
Define internal combustion engine and explain how it is different from external combustion engines?
-
In I.C. engines, power developed inside the cylinder is known as: (a) Brake horse power (b) Indicated horse power (c) Pumping power (d) None of the above
-
The power spent in suction and exhaust strokes are known as: (a) Brake horse power (b) Indicated horse power (c) Pumping power (d) None of the above

Study smarter with the SolutionInn App