

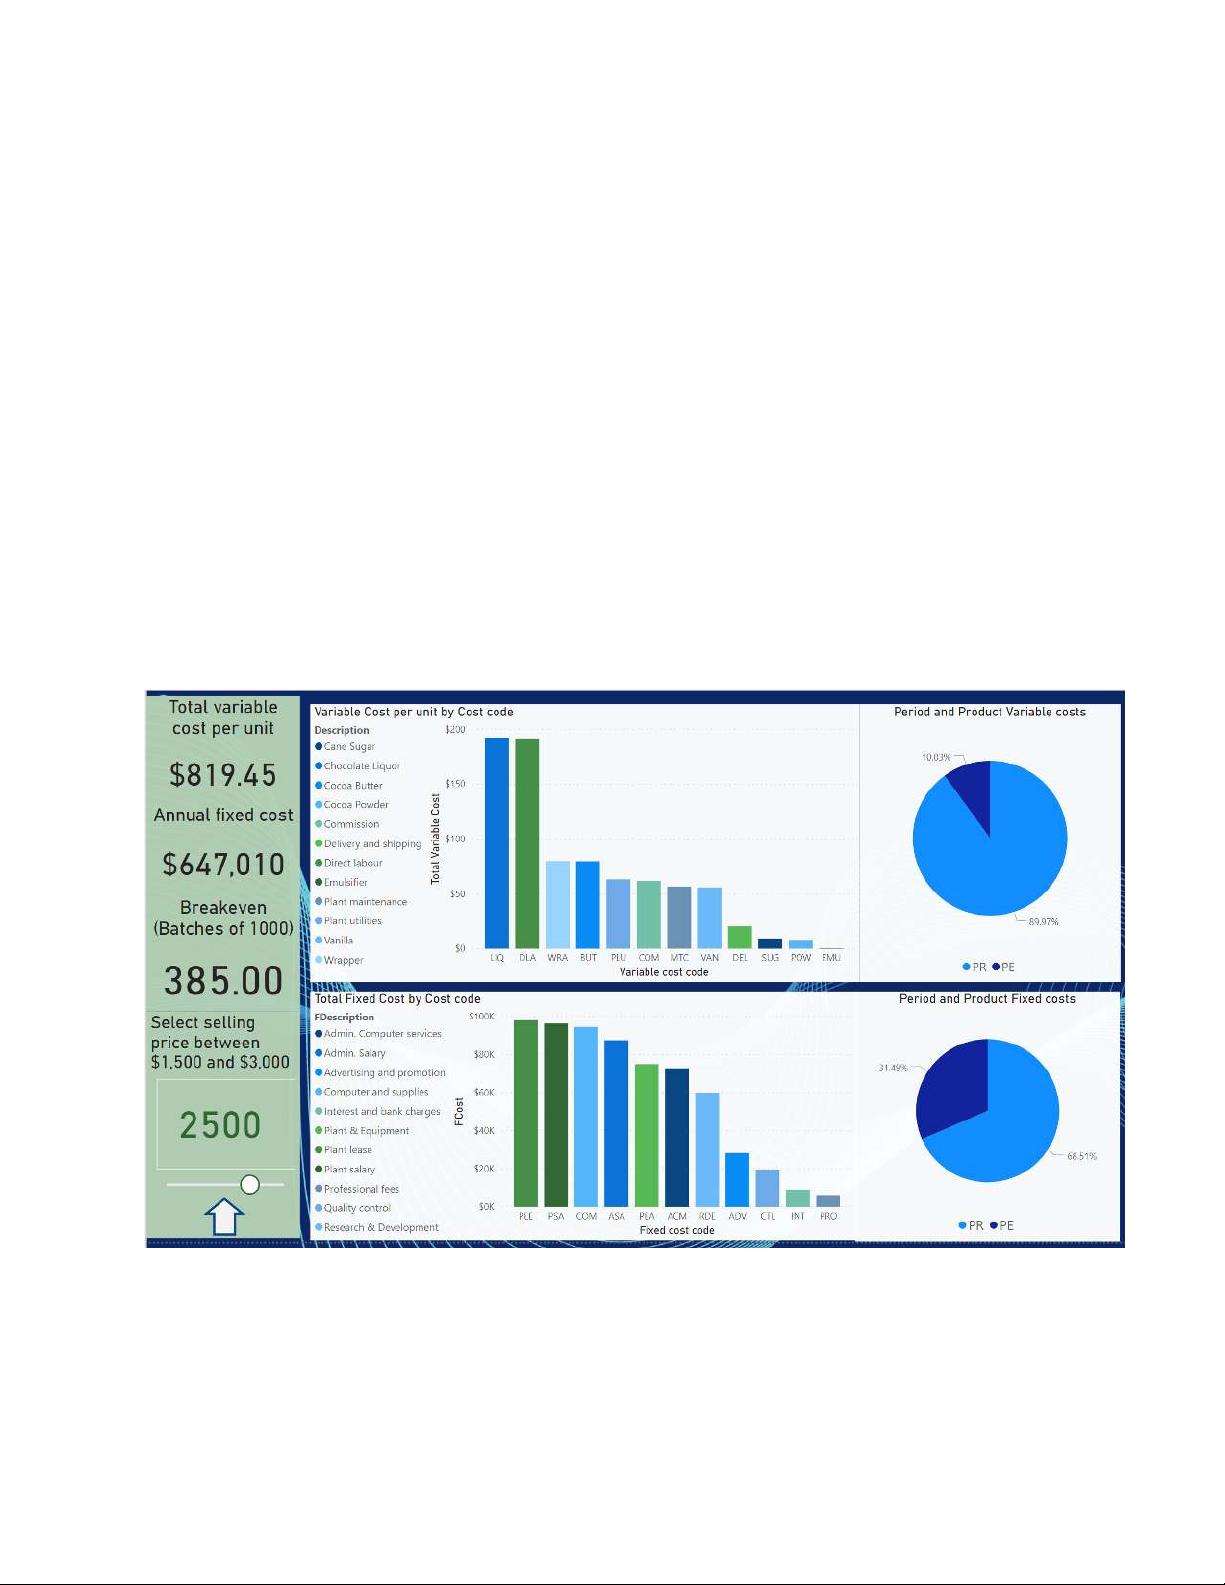
The Boston Bar Chocolate Company (BBCC) is a privately owned business that takes pride in the...
Fantastic news! We've Found the answer you've been seeking!
Question:
Transcribed Image Text:
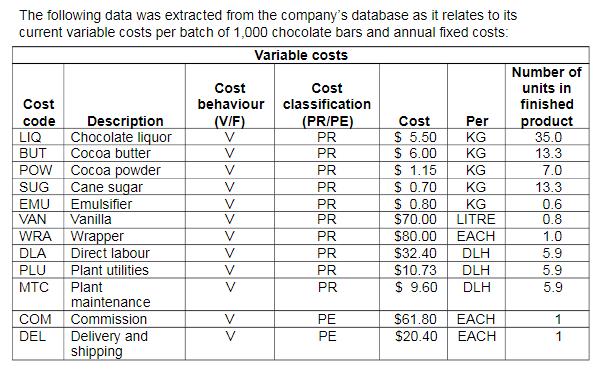
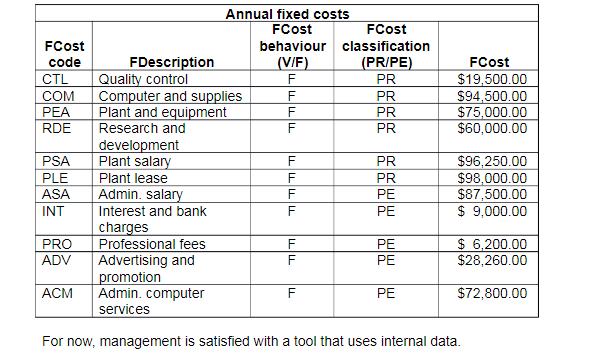
The Boston Bar Chocolate Company (BBCC) is a privately owned business that takes pride in the value of its tasty and healthy chocolate bars. The company wholesales its product to high-end grocery outlets that specialize in gourmet foods. Customers keep coming back for more of BBCC's product, not only because of the great taste, but also because of the growing number of health reports stating that the flavanols in chocolate help to reduce blood pressure and increase memory retention. This gives the company a competitive advantage in the premium-quality chocolate market. The company's management team is deeply invested in the use of data from a variety of sources, both internal and external, to be proactive to changing costs in the manufacturing of its chocolate bars, which are produced in batches of 1,000 bars. This will assist it in setting selling prices that will attract customer demand while reducing the risk of loss. It has engaged the use of an outside data analyst to assist in the development of a tool that can be used to both monitor and predict break-even points. As a starting point, the data analyst has sketched out the following prototype of a dashboard that can be used for this analysis: Total variable cost per unit $819.45 Annual fixed cost $647,010 Breakeven (Batches of 1000) 385.00 Select selling price between $1.500 and $3.000 2500 1 command Variable Cost per unit by Cost code Description $200 ●Cane Sugar Chocolate Liquor $150 Cocoa Butter Cocoa Powder Commission $100 Delivery and shipping Direct labour Emulsifier $50 Plant maintenance Plant utilities Vanila $0 Wrapper THERN Total Fixed Cost by Cost code FDescription $100K Admin, Computer services Admin. Salary $80K Advertising and promotion Computer and supplies. $60K Interest and bank charges Plant & Equipment $40K Plant lease ●Plant salary $20K Professional fees SOK Quality control Research & Development Total Variable Cost LIQ DLA WRA BUT PLU COM MTC VAN DEL SUS POW EMU Variable cost code PEA ACM RDE ADV CEL INT PRO Fixed cost code PEL PSA COM ASA Period and Product Variable costs. 10.03% 89.97% PROPE Period and Product Fixed costs. 31.49% PR PE 68.51% The following data was extracted from the company's database as it relates to its current variable costs per batch of 1,000 chocolate bars and annual fixed costs: Variable costs Cost Cost behaviour classification Cost code (V/F) (PR/PE) Cost Per Description Chocolate liquor LIQ V PR $ 5.50 KG BUT Cocoa butter V PR $ 6.00 KG POW Cocoa powder V PR $ 1.15 KG V PR $ 0.70 KG SUG Cane sugar Emulsifier EMU V PR $ 0.80 KG VAN Vanilla V $70.00 LITRE WRA Wrapper V $80.00 EACH DLA Direct labour V $32.40 DLH PLU Plant utilities V $10.73 DLH MTC Plant V $ 9.60 DLH maintenance COM Commission V $61.80 EACH DEL Delivery and V $20.40 EACH shipping XXXXXX 2 סס PR PR PR PR PR PE PE Number of units in finished product 35.0 13.3 7.0 13.3 0.6 0.8 1.0 5.9 5.9 5.9 1 1 Annual fixed costs FCost FCost behaviour classification (V/F) (PR/PE) F PR F PR F PR F PR FCost code FDescription CTL Quality control COM Computer and supplies ΡΕΑ Plant and equipment Research and RDE development PSA Plant salary PLE Plant lease ASA Admin. salary INT Interest and bank charges PRO Professional fees F PE ADV Advertising and F PE promotion ACM Admin. computer F PE services For now, management is satisfied with a tool that uses internal data. FFF XXXX XXH2 22 F PR PR PE PE FCost $19,500.00 $94,500.00 $75,000.00 $60,000.00 $96,250.00 $98,000.00 $87,500.00 $ 9,000.00 $ 6,200.00 $28,260.00 $72,800.00 Required: a) As the data analyst, you are required to develop the prototype into a dashboard using Power BI. The dashboard will not only inform on costs by behaviour, but also allow the management team to determine break-even batches based on proposed selling price per batch. The process to create the dashboard is broken into the following tasks: • Task 1: Develop a visualization of total variable costs per unit and a visualization of total annual fixed costs using the Card function. Steps 1 and 2-Appendix Task 2: Develop a visualization that illustrates the variable costs using a bar chart and a visualization that illustrates the fixed costs using a bar chart. Steps 3 and 4-Appendix • Task 3: Develop a visualization that illustrates the proportion of period and product costs for fixed costs using a pie chart and a visualization that illustrates the proportion of period and product costs for variable costs using a pie chart. Steps 5 and 6-Appendix • Task 4: Develop a "what-if" analysis that allows the user to enter a selling price per batch between $1,200 and $3,000 and predict the break-even point in batches. This will result in an input field using a slider and a card visualization that displays the break-even point in batches. Steps 7 and 8 - Appendix . Task 5: Arrange the components into a dashboard that looks similar to the prototype. b) Using the working dashboard, answer the following questions: i) Report the break-even point at the following selling prices per batch (round up to the nearest batch): 1. $2,000 2. $2,500 3. $3,000 ii) How does the batches-to-break-even figure change when only the product costs are taken into consideration? Use the selling prices from part (1). (Hint: Hold down the CTRL key and click on the Product Cost slice of the pie charts for both fixed and variable costs. The left sidebar will display results for only product costs.) iii) How does the batches-to-break-even figure change if advertising and promotion costs are eliminated and selling price is $1,500? c) Ideally, management would like to tie this information into extemal data to produce more results in real time and to make more predictions. Provide management with two ways in which the use of external data can improve this model. Your answer should discuss the possibilities of using both structured and unstructured external data. It is important that you save the Power BI file you have completed and save it to your desktop. You will need it for working on your assignment project. The Boston Bar Chocolate Company (BBCC) is a privately owned business that takes pride in the value of its tasty and healthy chocolate bars. The company wholesales its product to high-end grocery outlets that specialize in gourmet foods. Customers keep coming back for more of BBCC's product, not only because of the great taste, but also because of the growing number of health reports stating that the flavanols in chocolate help to reduce blood pressure and increase memory retention. This gives the company a competitive advantage in the premium-quality chocolate market. The company's management team is deeply invested in the use of data from a variety of sources, both internal and external, to be proactive to changing costs in the manufacturing of its chocolate bars, which are produced in batches of 1,000 bars. This will assist it in setting selling prices that will attract customer demand while reducing the risk of loss. It has engaged the use of an outside data analyst to assist in the development of a tool that can be used to both monitor and predict break-even points. As a starting point, the data analyst has sketched out the following prototype of a dashboard that can be used for this analysis: Total variable cost per unit $819.45 Annual fixed cost $647,010 Breakeven (Batches of 1000) 385.00 Select selling price between $1.500 and $3.000 2500 1 command Variable Cost per unit by Cost code Description $200 ●Cane Sugar Chocolate Liquor $150 Cocoa Butter Cocoa Powder Commission $100 Delivery and shipping Direct labour Emulsifier $50 Plant maintenance Plant utilities Vanila $0 Wrapper THERN Total Fixed Cost by Cost code FDescription $100K Admin, Computer services Admin. Salary $80K Advertising and promotion Computer and supplies. $60K Interest and bank charges Plant & Equipment $40K Plant lease ●Plant salary $20K Professional fees SOK Quality control Research & Development Total Variable Cost LIQ DLA WRA BUT PLU COM MTC VAN DEL SUS POW EMU Variable cost code PEA ACM RDE ADV CEL INT PRO Fixed cost code PEL PSA COM ASA Period and Product Variable costs. 10.03% 89.97% PROPE Period and Product Fixed costs. 31.49% PR PE 68.51% The following data was extracted from the company's database as it relates to its current variable costs per batch of 1,000 chocolate bars and annual fixed costs: Variable costs Cost Cost behaviour classification Cost code (V/F) (PR/PE) Cost Per Description Chocolate liquor LIQ V PR $ 5.50 KG BUT Cocoa butter V PR $ 6.00 KG POW Cocoa powder V PR $ 1.15 KG V PR $ 0.70 KG SUG Cane sugar Emulsifier EMU V PR $ 0.80 KG VAN Vanilla V $70.00 LITRE WRA Wrapper V $80.00 EACH DLA Direct labour V $32.40 DLH PLU Plant utilities V $10.73 DLH MTC Plant V $ 9.60 DLH maintenance COM Commission V $61.80 EACH DEL Delivery and V $20.40 EACH shipping XXXXXX 2 סס PR PR PR PR PR PE PE Number of units in finished product 35.0 13.3 7.0 13.3 0.6 0.8 1.0 5.9 5.9 5.9 1 1 Annual fixed costs FCost FCost behaviour classification (V/F) (PR/PE) F PR F PR F PR F PR FCost code FDescription CTL Quality control COM Computer and supplies ΡΕΑ Plant and equipment Research and RDE development PSA Plant salary PLE Plant lease ASA Admin. salary INT Interest and bank charges PRO Professional fees F PE ADV Advertising and F PE promotion ACM Admin. computer F PE services For now, management is satisfied with a tool that uses internal data. FFF XXXX XXH2 22 F PR PR PE PE FCost $19,500.00 $94,500.00 $75,000.00 $60,000.00 $96,250.00 $98,000.00 $87,500.00 $ 9,000.00 $ 6,200.00 $28,260.00 $72,800.00 Required: a) As the data analyst, you are required to develop the prototype into a dashboard using Power BI. The dashboard will not only inform on costs by behaviour, but also allow the management team to determine break-even batches based on proposed selling price per batch. The process to create the dashboard is broken into the following tasks: • Task 1: Develop a visualization of total variable costs per unit and a visualization of total annual fixed costs using the Card function. Steps 1 and 2-Appendix Task 2: Develop a visualization that illustrates the variable costs using a bar chart and a visualization that illustrates the fixed costs using a bar chart. Steps 3 and 4-Appendix • Task 3: Develop a visualization that illustrates the proportion of period and product costs for fixed costs using a pie chart and a visualization that illustrates the proportion of period and product costs for variable costs using a pie chart. Steps 5 and 6-Appendix • Task 4: Develop a "what-if" analysis that allows the user to enter a selling price per batch between $1,200 and $3,000 and predict the break-even point in batches. This will result in an input field using a slider and a card visualization that displays the break-even point in batches. Steps 7 and 8 - Appendix . Task 5: Arrange the components into a dashboard that looks similar to the prototype. b) Using the working dashboard, answer the following questions: i) Report the break-even point at the following selling prices per batch (round up to the nearest batch): 1. $2,000 2. $2,500 3. $3,000 ii) How does the batches-to-break-even figure change when only the product costs are taken into consideration? Use the selling prices from part (1). (Hint: Hold down the CTRL key and click on the Product Cost slice of the pie charts for both fixed and variable costs. The left sidebar will display results for only product costs.) iii) How does the batches-to-break-even figure change if advertising and promotion costs are eliminated and selling price is $1,500? c) Ideally, management would like to tie this information into extemal data to produce more results in real time and to make more predictions. Provide management with two ways in which the use of external data can improve this model. Your answer should discuss the possibilities of using both structured and unstructured external data. It is important that you save the Power BI file you have completed and save it to your desktop. You will need it for working on your assignment project.
Expert Answer:
Answer rating: 100% (QA)
1 Formula BEP in units Total fixed costCM per batch BEP in pesos Total fixed cost CM ratio CM per desired selling price Selling price Variable CM CM ratio 2000 81945 118055 059 2500 81945 168055 067 3... View the full answer

Related Book For 

Posted Date:
Students also viewed these accounting questions
-
Venus Family Packaging is a privately owned business that has been in operation since the late 1800s. The business, which has grown at a moderate pace, has remained competitive due to its dedication...
-
Interior Design Inc. (ID) is a privately owned business that produces interior decorating options for consumers. ID follows ASPE. The software that it purchased six years ago to present clients with...
-
Interior Design Inc. (ID) is a privately owned business that produces interior decorating options for consumers. ID has chosen to follow private enterprise GAAP . The software that it purchased 10...
-
Evaluate and simplify the following derivatives. d dw -(e-w In w)
-
Refer to Exercise 4.11. Compute the following probabilities: a. P(A| B) b. P(A| C) c. P(B| C) In exercise 4.11 Assume that the die is a fair die, that is, each of the outcomes has a probability of...
-
The steel rod has a circular cross section. If it is gripped at its ends and a couple moment of M = 12 lb · in is developed at each grip, determine the stress acting at points A and B and at...
-
The manufacturer of an electric table saw claims that it has a 3.0 horsepower motor. 1 horsepower is approximately \(750 \mathrm{~W}\). It is designed to be used on a normal \(120 \mathrm{~V}\)...
-
Shinlund, Inc., reported a net cash flow from operating activities of $243,750 on its statement of cash flows for the year ended December 31, 2012. The following information was reported in the Cash...
-
Why is it a prudent policy to separate credit appraisal and sanctioning from the work out function?
-
Waterways puts much emphasis on cash flow when it plans for capital investments. The company chose its discount rate of 8% based on the rate of return it must pay its owners and creditors. Using that...
-
Explain fundamental safety principles and the three- and five-levels safety of nuclear reactors.
-
How did the decision in Hedley Byrne v. Heller & Partners address the issue in Question 5?
-
We have a parliament to pass laws, a government to administer laws, and a police department to enforce laws. Ironically, these potent instruments for the restriction of liberty are necessary for the...
-
Blue Coral Breweries (BCB) is planning an IPO. Its underwriters have said the stock will sell at $20 per share. The direct costs (legal fees, printing, etc.) will be $800,000. The underwriters will...
-
When banks become reluctant to lend to each other the 3-month LIBOROIS spread increases. Explain this statement.
-
1 ) The International Wages for Housework Campaign was a global social movement founded in 1 9 7 2 in Padua, Italy. The Campaign was formed to raise awareness of how housework and childcareare the...
-
Suppose the concentration of glucose inside a cell is 0.1 mm and the cell is suspended in a glucose solution of 0.01 mm. a. What would be the free energy change involved in transporting 10-o mole of...
-
Wingo Widgets makes and sells widgets to individual and corporate customers. Widgets cost $1.75 to make and are sold for $3.00 each. Individual customers typically require little service beyond order...
-
Maverick Wings, Inc. manufactures airplanes for use in stunt shows. Maverick's factory is highly automated, using the latest in robotic technology. To keep costs low, the company employs as few...
-
The following list includes activities that are performed in a clothing store. Classify each activity as value added or non-value-added. For each non-value-added activity, state whether it can be...
-
Let \(\left\{x_{n}ight\}_{n=1}^{\infty}\) be a sequence of real numbers defined by \[x_{n}=\frac{n}{n+1}-\frac{n+1}{n},\] for all \(n \in \mathbb{N}\). Compute \[\liminf _{n ightarrow \infty}...
-
Let \(\left\{x_{n}ight\}_{n=1}^{\infty}\) be a sequence of real numbers defined by \[x_{n}=\left\{\begin{array}{rl}-1 & n=1+3(k-1), k \in \mathbb{N} \\0 & n=2+3(k-1), k \in \mathbb{N} \\1 &...
-
Let \(\left\{x_{n}ight\}_{n=1}^{\infty}\) and \(\left\{y_{n}ight\}_{n=1}^{\infty}\) be sequences of real numbers such that \[\lim _{n ightarrow \infty} x_{n}=x\] and \[\lim _{n ightarrow \infty}...

Study smarter with the SolutionInn App