

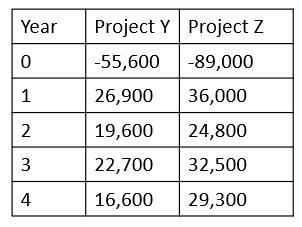
The below chart shows the cashflows of two possible projects (Project Y and Project Z). The required
Fantastic news! We've Found the answer you've been seeking!
Question:
The below chart shows the cashflows of two possible projects (Project Y and Project Z). The required return is 12%.
Therefore, what are the respective profitability indices, NPVs for each project? Also, which project shall the company accept?
Expert Answer:

Related Book For 

Posted Date:
