

The file Comm172 Assignment1 Data 2021.xlsx contains store sales data for Heineken beer. The data for...
Fantastic news! We've Found the answer you've been seeking!
Question:
Transcribed Image Text:
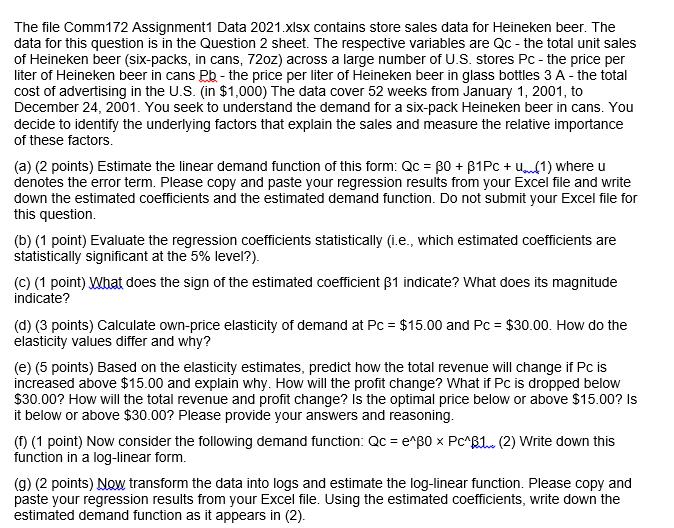
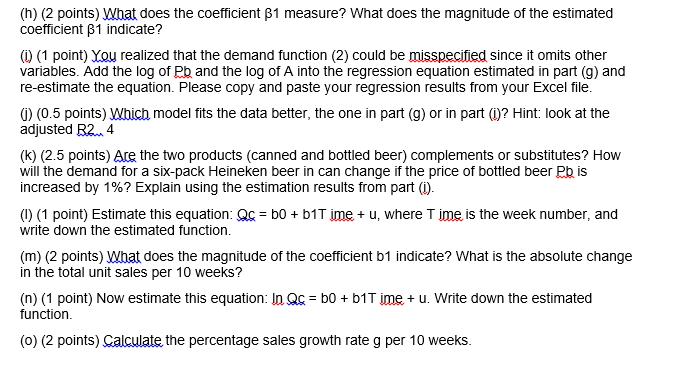
The file Comm172 Assignment1 Data 2021.xlsx contains store sales data for Heineken beer. The data for this question is in the Question 2 sheet. The respective variables are Qc - the total unit sales of Heineken beer (six-packs, in cans, 72oz) across a large number of U.S. stores Pc - the price per liter of Heineken beer in cans Pb - the price per liter of Heineken beer in glass bottles 3 A - the total cost of advertising in the U.S. (in $1,000) The data cover 52 weeks from January 1, 2001, to December 24, 2001. You seek to understand the demand for a six-pack Heineken beer in cans. You decide to identify the underlying factors that explain the sales and measure the relative importance of these factors. (a) (2 points) Estimate the linear demand function of this form: Qc = 30 + B1Pc + U(1) where u denotes the error term. Please copy and paste your regression results from your Excel file and write down the estimated coefficients and the estimated demand function. Do not submit your Excel file for this question. (b) (1 point) Evaluate the regression coefficients statistically (i.e., which estimated coefficients are statistically significant at the 5% level?). (c) (1 point) What does the sign of the estimated coefficient 31 indicate? What does its magnitude indicate? (d) (3 points) Calculate own-price elasticity of demand at Pc = $15.00 and Pc = $30.00. How do the elasticity values differ and why? (e) (5 points) Based on the elasticity estimates, predict how the total revenue will change if Pc is increased above $15.00 and explain why. How will the profit change? What if Pc is dropped below $30.00? How will the total revenue and profit change? Is the optimal price below or above $15.00? Is it below or above $30.00? Please provide your answers and reasoning. (f) (1 point) Now consider the following demand function: Qc = e^30 x Pc^B1... (2) Write down this function in a log-linear form. (g) (2 points) Now transform the data into logs and estimate the log-linear function. Please copy and paste your regression results from your Excel file. Using the estimated coefficients, write down the estimated demand function as it appears in (2). (h) (2 points) What does the coefficient 31 measure? What does the magnitude of the estimated coefficient 31 indicate? (1) (1 point) You realized that the demand function (2) could be misspecified since it omits other variables. Add the log of Pb and the log of A into the regression equation estimated in part (g) and re-estimate the equation. Please copy and paste your regression results from your Excel file. (i) (0.5 points) Which model fits the data better, the one in part (g) or in part (1)? Hint: look at the adjusted B2 4 (k) (2.5 points) Ace the two products (canned and bottled beer) complements or substitutes? How will the demand for a six-pack Heineken beer in can change if the price of bottled beer Pb is increased by 1%? Explain using the estimation results from part (i). (1) (1 point) Estimate this equation: Qc = b0 + b1T ime + u, where Time is the week number, and write down the estimated function. (m) (2 points) What does the magnitude of the coefficient b1 indicate? What is the absolute change in the total unit sales per 10 weeks? (n) (1 point) Now estimate this equation: In Qc = b0 + b1T ime + u. Write down the estimated function. (0) (2 points) Calculate the percentage sales growth rate g per 10 weeks. Q 338 361 382 406 308 324 311 311 301 296 321 550 461 283 377 360 314 314 310 334 306 305 293 527 L 5215 6623 6859 7948 4560 5081 5383 4410 4294 3913 6116 25411 18043 3351 7038 5719 4248 5036 4278 5175 4343 4675 3985 16359 527 559 319 375 342 408 357 317 330 288 315 291 487 533 320 297 333 359 329 308 323 276 308 293 428 16359 27389 5875 7021 7123 10989 6626 4389 5530 3586 4721 4685 19869 22663 4700 3723 6745 7876 5181 4838 6014 3424 4634 3523 12484 The file Comm172 Assignment1 Data 2021.xlsx contains store sales data for Heineken beer. The data for this question is in the Question 2 sheet. The respective variables are Qc - the total unit sales of Heineken beer (six-packs, in cans, 72oz) across a large number of U.S. stores Pc - the price per liter of Heineken beer in cans Pb - the price per liter of Heineken beer in glass bottles 3 A - the total cost of advertising in the U.S. (in $1,000) The data cover 52 weeks from January 1, 2001, to December 24, 2001. You seek to understand the demand for a six-pack Heineken beer in cans. You decide to identify the underlying factors that explain the sales and measure the relative importance of these factors. (a) (2 points) Estimate the linear demand function of this form: Qc = 30 + B1Pc + U(1) where u denotes the error term. Please copy and paste your regression results from your Excel file and write down the estimated coefficients and the estimated demand function. Do not submit your Excel file for this question. (b) (1 point) Evaluate the regression coefficients statistically (i.e., which estimated coefficients are statistically significant at the 5% level?). (c) (1 point) What does the sign of the estimated coefficient 31 indicate? What does its magnitude indicate? (d) (3 points) Calculate own-price elasticity of demand at Pc = $15.00 and Pc = $30.00. How do the elasticity values differ and why? (e) (5 points) Based on the elasticity estimates, predict how the total revenue will change if Pc is increased above $15.00 and explain why. How will the profit change? What if Pc is dropped below $30.00? How will the total revenue and profit change? Is the optimal price below or above $15.00? Is it below or above $30.00? Please provide your answers and reasoning. (f) (1 point) Now consider the following demand function: Qc = e^30 x Pc^B1... (2) Write down this function in a log-linear form. (g) (2 points) Now transform the data into logs and estimate the log-linear function. Please copy and paste your regression results from your Excel file. Using the estimated coefficients, write down the estimated demand function as it appears in (2). (h) (2 points) What does the coefficient 31 measure? What does the magnitude of the estimated coefficient 31 indicate? (1) (1 point) You realized that the demand function (2) could be misspecified since it omits other variables. Add the log of Pb and the log of A into the regression equation estimated in part (g) and re-estimate the equation. Please copy and paste your regression results from your Excel file. (i) (0.5 points) Which model fits the data better, the one in part (g) or in part (1)? Hint: look at the adjusted B2 4 (k) (2.5 points) Ace the two products (canned and bottled beer) complements or substitutes? How will the demand for a six-pack Heineken beer in can change if the price of bottled beer Pb is increased by 1%? Explain using the estimation results from part (i). (1) (1 point) Estimate this equation: Qc = b0 + b1T ime + u, where Time is the week number, and write down the estimated function. (m) (2 points) What does the magnitude of the coefficient b1 indicate? What is the absolute change in the total unit sales per 10 weeks? (n) (1 point) Now estimate this equation: In Qc = b0 + b1T ime + u. Write down the estimated function. (0) (2 points) Calculate the percentage sales growth rate g per 10 weeks. Q 338 361 382 406 308 324 311 311 301 296 321 550 461 283 377 360 314 314 310 334 306 305 293 527 L 5215 6623 6859 7948 4560 5081 5383 4410 4294 3913 6116 25411 18043 3351 7038 5719 4248 5036 4278 5175 4343 4675 3985 16359 527 559 319 375 342 408 357 317 330 288 315 291 487 533 320 297 333 359 329 308 323 276 308 293 428 16359 27389 5875 7021 7123 10989 6626 4389 5530 3586 4721 4685 19869 22663 4700 3723 6745 7876 5181 4838 6014 3424 4634 3523 12484
Expert Answer:
Answer rating: 100% (QA)
a For a sixpack of Heineken beer in cans the linear demand function is Qc 80 81Pc u The coefficient on the price per liter ... View the full answer

Related Book For 

Posted Date:
Students also viewed these accounting questions
-
A case of 24 cans contains 1 can that is contaminated. Three cans are to be chosen randomly for testing. a. How many different combinations of three cans could be selected? b. What is the probability...
-
To help understand the factors impacting a sales budget, you are to visit three businesses with the same ownership or franchise membership. Record the selling prices of two identical products at each...
-
The demand for beer in Japan is given by the following equation: Qd = 700 2P PN + 0.1I, where P is the price of beer, PN is the price of nuts, and I is average consumer income. a) What happens to...
-
How did your parents communication with you influence your self-concept?
-
Air expands in an isentropic horizontal nozzle from inlet conditions of 1.0 MPa, 850 K, 100 m/s to an exhaust pressure of 100 kPa. Using Nozzle Simulator RIA(linked from the left margin). (a)...
-
Revise Listing 3.8, Lottery.java, to generate a lottery of a threedigit number. The program prompts the user to enter a three-digit number and determines whether the user wins according to the...
-
Regional Support for Same Sex Marriage The website http://www.pewresearch.org/ fact-tank/2014/10/15/gay - marriage - arrives - in -the - south-where-the-public-is-less-enthused shows the changing...
-
Use the same information as in E10-8, except that the warehouse owned by Denver Company has a fair value of $28,000, and therefore Denver agrees to pay Bristol $2,000 to complete the exchange....
-
We have a B field pointing into OR out of the page. An proton is fired into the region with initial speed of 5 m/s directly to the right. The height of the opening is 10 cm. We want the proton to hit...
-
Southwick Company uses normal costing in its job- costing system. Partially completed T- accounts and additional information for Southwick for 2012 are as follows: Required Additional information...
-
Strawberry Mansion Company produced 5,900 cakes that require 3 standard pounds per unit at $2.00 standard price per pound for a total of $35,400. The company actually used 17,880 pounds in production...
-
Assume that a company is based in a country that has no taxes on dividends or capital gains. The company is considering either paying a special dividend or repurchasing its own shares. Shareholders...
-
If Sky Systems were to be acquired by Modern Auto under the terms of the original offer, the post-merger EPS of the new company would be closest to: A. \($2.00\). B. \($2.32\). C. \($2.63\). Modern...
-
After estimating the model \(y=\beta_{1}+\beta_{2} x_{2}+\beta_{3} x_{3}+e\) with \(N=203\) observations, we obtain the following information: \(\sum_{i=1}^{N}\left(x_{i 2}-\bar{x}_{2}...
-
William Jones is evaluating three possible means of borrowing $1 million for one month: 1. Drawing down on a line of credit at 7.2% with a 1/2 percent commitment fee on the full amount with no...
-
Suppose a company has a current ratio of 2.5 times and a quick ratio of 1.5 times. If the companys current liabilities are h100 million, the amount of inventory is closest to: A. h50 million. B. h100...
-
Summarize this context At the end of the answer include references in APA Style Global infrastructure needs A stocktaking of global infrastructure needs reveals varying numbers and methods, yet all...
-
In a large midwestern university, 30% of the students live in apartments. If 200 students are randomly selected, find the probability that the number of them living in apartments will be between 55...
-
Consider the Coke and Pepsi example discussed in the chapter. a) Explain why each firm's reaction function slopes upward. That is, why does Coke's profit-maximizing price go up the higher is Pepsi's...
-
Suppose a production function is given by Q = 10K + 2L. The factor price of labor is 1. Draw the demand curve for capital when the firm is required to produce Q = 80.
-
Sarah consumes apples and oranges (these are the only fruits she eats). She has decides that her monthly budget for fruit will be $50. Suppose that one apple costs $0.25, while one orange costs...
-
The \(x\) component of the velocity of a car changes from \(-10 \mathrm{~m} / \mathrm{s}\) to \(-2.0 \mathrm{~m} / \mathrm{s}\) in \(10 \mathrm{~s}\). (a) Is the car traveling in the positive or...
-
The day after the incident described in Problem 44, the instructor finds herself in the same situation. This time, she tries a harder physics exercise. She keeps running at a constant \(6.0...
-
(a) A car is speeding up in the negative \(x\) direction. In what direction do \(\vec{a}\) and \(\vec{v}\) point? (b) To which of the four graphs in Figures 3 . 2 and 3 . 3 does the situation...

Study smarter with the SolutionInn App