

The following table shows some information on a variety of different vehicles. Using the information given...
Fantastic news! We've Found the answer you've been seeking!
Question:
Transcribed Image Text:
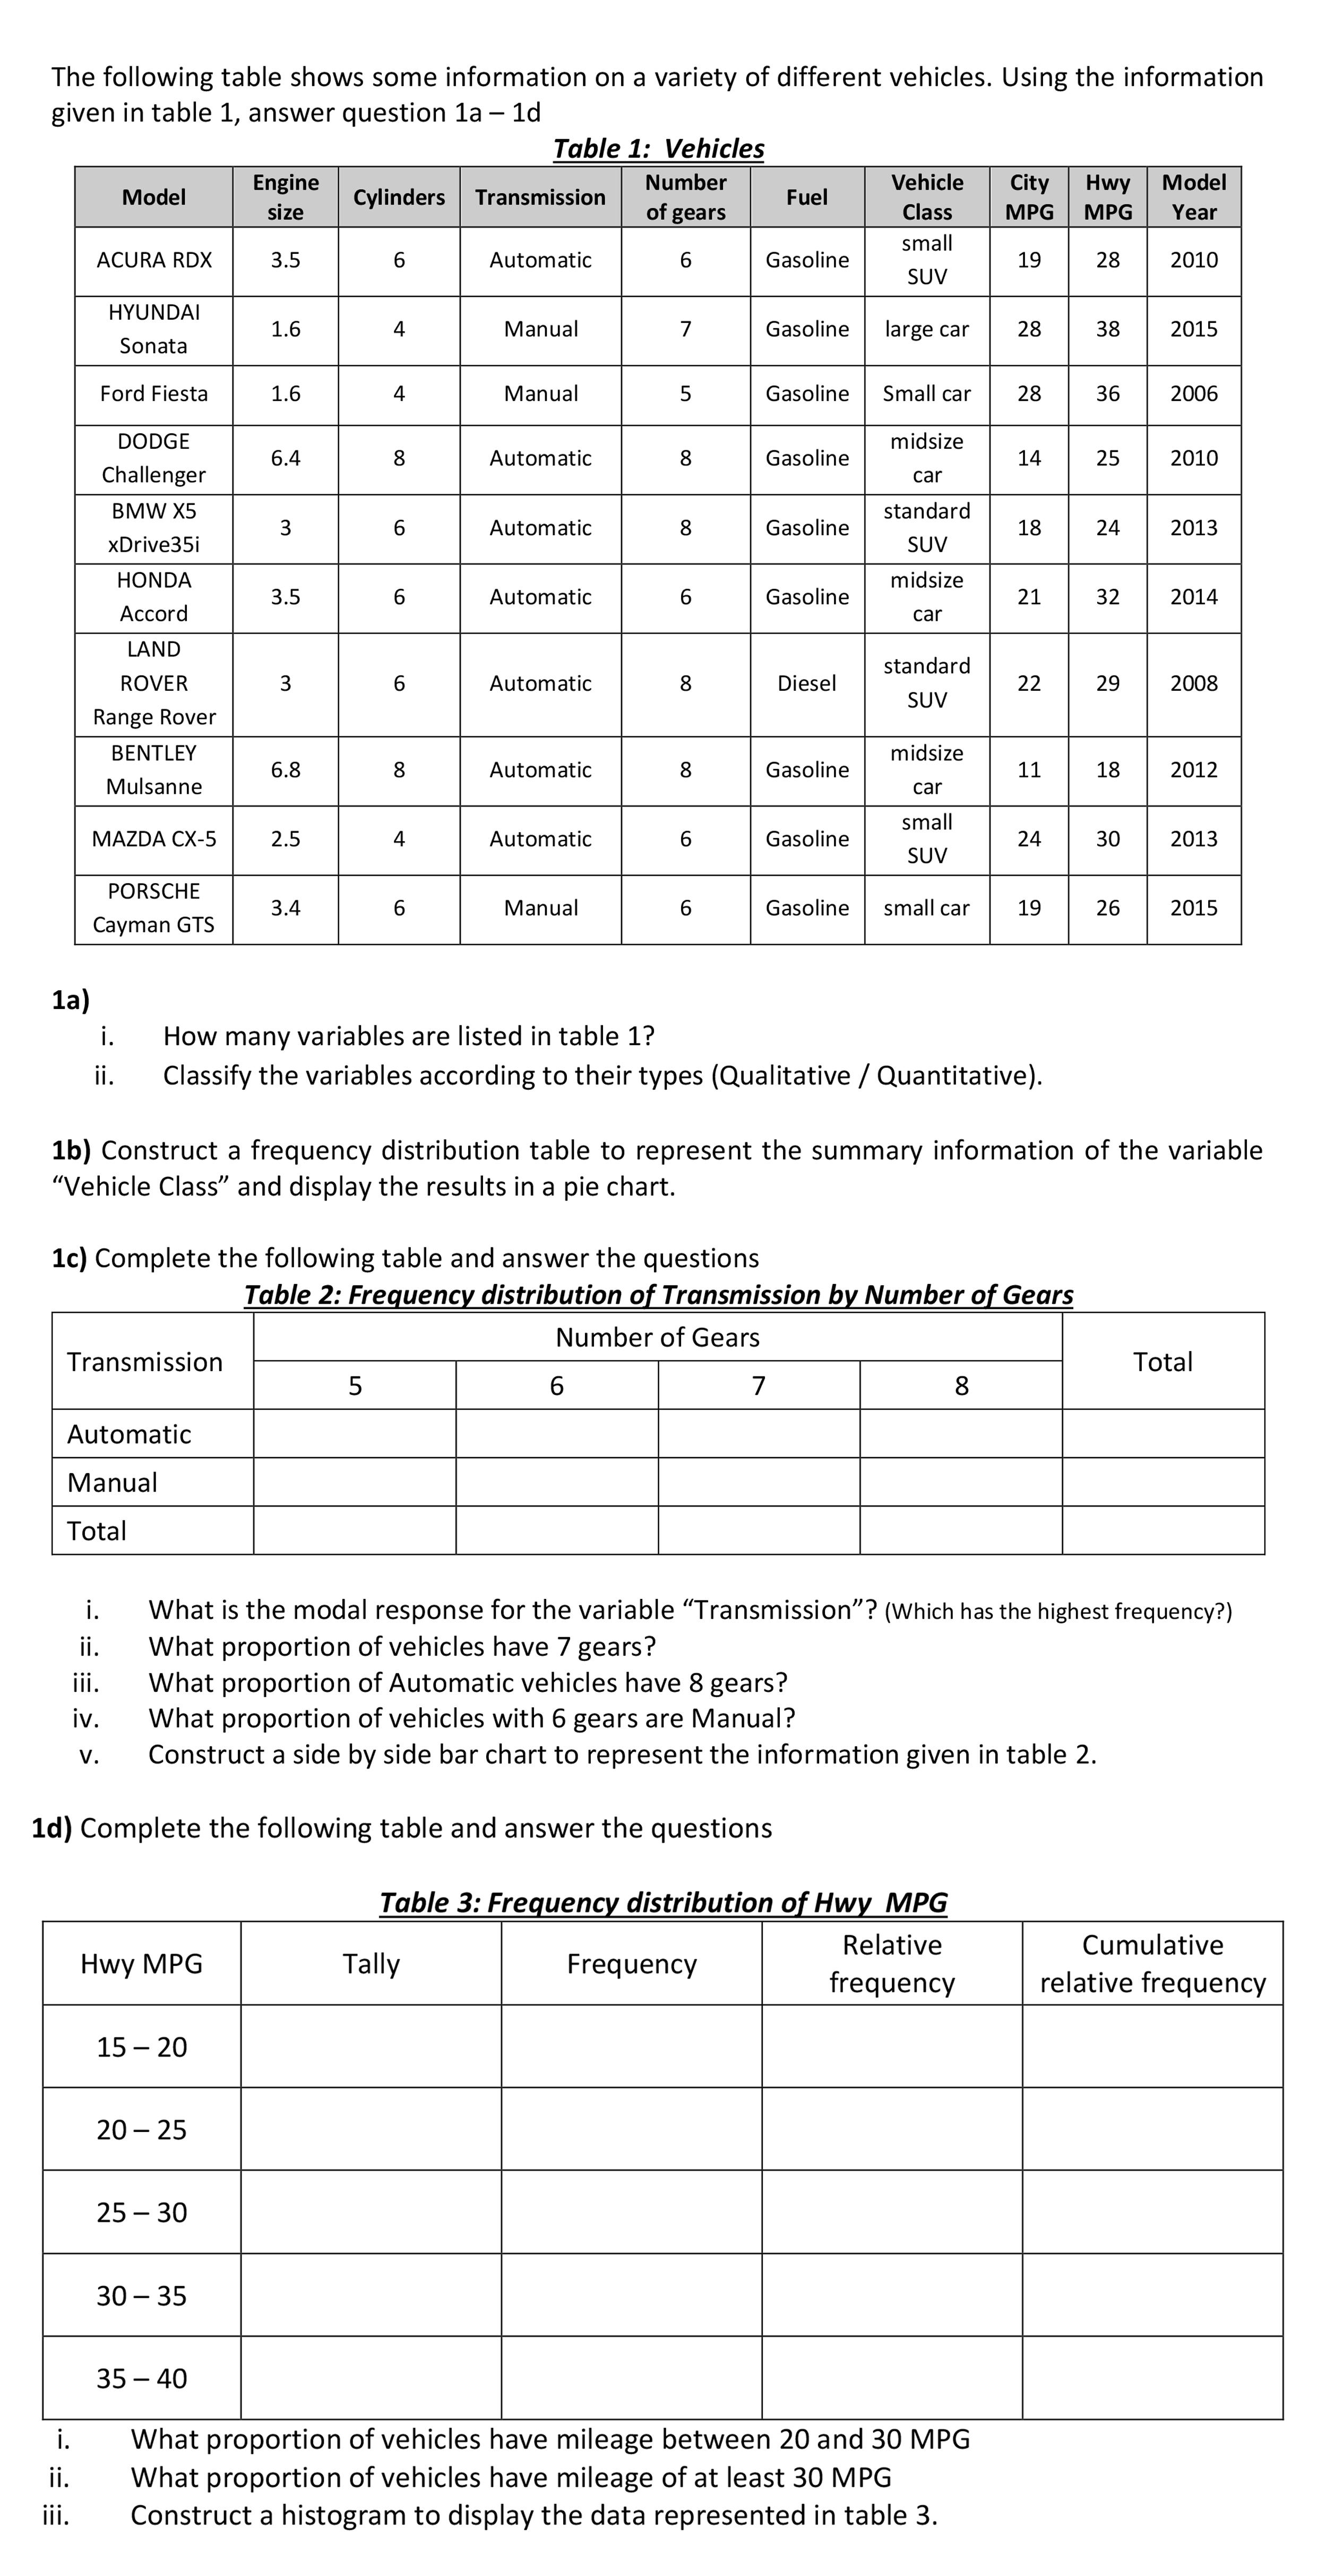
The following table shows some information on a variety of different vehicles. Using the information given in table 1, answer question 1a – 1d - Table 1: Vehicles Engine Number Vehicle City Hwy Model Model Cylinders Transmission Fuel size of gears Class MPG MPG Year small ACURA RDX 3.5 Automatic Gasoline 19 28 2010 SUV HYUNDAI 1.6 4 Manual 7 Gasoline large car 28 38 2015 Sonata Ford Fiesta 1.6 4 Manual Gasoline Small car 28 36 2006 DODGE midsize 6.4 8. Automatic 8. Gasoline 14 25 2010 Challenger car BMW X5 standard 3 6 Automatic 8 Gasoline 18 24 2013 xDrive35i SUV HONDA midsize 3.5 Automatic Gasoline 21 32 2014 Аccord car LAND standard ROVER 3 6. Automatic 8 Diesel 22 29 2008 SUV Range Rover BENTLEY midsize 6.8 8. Automatic 8 Gasoline 11 18 2012 Mulsanne car small MAZDA CX-5 2.5 4 Automatic Gasoline 24 30 2013 SUV PORSCHE 3.4 6. Manual Gasoline small car 19 26 2015 Cayman GTS 1a) i. How many variables are listed in table 1? ii. Classify the variables according to their types (Qualitative / Quantitative). 1b) Construct a frequency distribution table to represent the summary information of the variable "Vehicle Class" and display the results in a pie chart. 1c) Complete the following table and answer the questions Table 2: Frequency distribution of Transmission by Number of Gears Number of Gears Transmission Total 6. 7 8 Automatic Manual Total What is the modal response for the variable "Transmission"? (Which has the highest frequency?) What proportion of vehicles have 7 gears? What proportion of Automatic vehicles have 8 gears? What proportion of vehicles with 6 gears are Manual? Construct a side by side bar chart to represent the information given in table 2. i. i. ii. iv. V. 1d) Complete the following table and answer the questions Table 3: Frequency distribution of Hwy MPG Relative Cumulative Hwy MPG Tally Frequency frequency relative frequency 15 – 20 20 – 25 25 – 30 30 – 35 35 – 40 What proportion of vehicles have mileage between 20 and 30 MPG What proportion of vehicles have mileage of at least 30 MPG Construct a histogram to display the data represented in table 3. i. ii. ii. The following table shows some information on a variety of different vehicles. Using the information given in table 1, answer question 1a – 1d - Table 1: Vehicles Engine Number Vehicle City Hwy Model Model Cylinders Transmission Fuel size of gears Class MPG MPG Year small ACURA RDX 3.5 Automatic Gasoline 19 28 2010 SUV HYUNDAI 1.6 4 Manual 7 Gasoline large car 28 38 2015 Sonata Ford Fiesta 1.6 4 Manual Gasoline Small car 28 36 2006 DODGE midsize 6.4 8. Automatic 8. Gasoline 14 25 2010 Challenger car BMW X5 standard 3 6 Automatic 8 Gasoline 18 24 2013 xDrive35i SUV HONDA midsize 3.5 Automatic Gasoline 21 32 2014 Аccord car LAND standard ROVER 3 6. Automatic 8 Diesel 22 29 2008 SUV Range Rover BENTLEY midsize 6.8 8. Automatic 8 Gasoline 11 18 2012 Mulsanne car small MAZDA CX-5 2.5 4 Automatic Gasoline 24 30 2013 SUV PORSCHE 3.4 6. Manual Gasoline small car 19 26 2015 Cayman GTS 1a) i. How many variables are listed in table 1? ii. Classify the variables according to their types (Qualitative / Quantitative). 1b) Construct a frequency distribution table to represent the summary information of the variable "Vehicle Class" and display the results in a pie chart. 1c) Complete the following table and answer the questions Table 2: Frequency distribution of Transmission by Number of Gears Number of Gears Transmission Total 6. 7 8 Automatic Manual Total What is the modal response for the variable "Transmission"? (Which has the highest frequency?) What proportion of vehicles have 7 gears? What proportion of Automatic vehicles have 8 gears? What proportion of vehicles with 6 gears are Manual? Construct a side by side bar chart to represent the information given in table 2. i. i. ii. iv. V. 1d) Complete the following table and answer the questions Table 3: Frequency distribution of Hwy MPG Relative Cumulative Hwy MPG Tally Frequency frequency relative frequency 15 – 20 20 – 25 25 – 30 30 – 35 35 – 40 What proportion of vehicles have mileage between 20 and 30 MPG What proportion of vehicles have mileage of at least 30 MPG Construct a histogram to display the data represented in table 3. i. ii. ii.
Expert Answer:
Answer rating: 100% (QA)
solution la i 10 variables or features of interest ii QUALITA... View the full answer

Posted Date:
Students also viewed these mathematics questions
-
The Internal Revenue Service provides information on a variety of tax issues in its publication series. These publications can be found on the IRS World Wide Web site...
-
The Internal Revenue Service provides information on a variety of tax issues in its publication series. These publications can be found on the IRS Web site (www.irs.gov/formspubs/index.html). Go to...
-
Using the information given in P15- 1 and P15- 2, record the transactions in general journal form. Then, post the journal entries to ledger T- accounts, like those shown in Table 15- 11. (To help...
-
Walmart Stores has run into opposition when it has tried to open stores in certain towns in the United States. Walmarts capital budgeting process has determined that these locations would be...
-
The paper referenced in Example 7.16 (Estimating Waste Transfer Station Delays Using GPS, Waste Management [2008]: 17421750) describing processing times for garbage trucks also provided information...
-
Suppose that the pound is pegged to gold at 6 pounds per ounce, whereas the franc is pegged to gold at 12 francs per ounce. This, of course, implies that the equilibrium exchange rate should be two...
-
What factors might the Supreme Court take into account in deciding whether to grant a writ of certiorari in a case?
-
Metal Manufacturing has isolated four alternatives for meeting its need for increased production capacity. The following table summarizes data gathered relative to each of these alternatives. a....
-
Total Energy (a) Conserved 12. Which one of the following is true in the case of inelastic collisions? Kinetic Energy Conserved Momentum Conserved (b) Conserved Not Conserved Conserved (c) Conserved...
-
Name the following alcohols according to the IUPAC nomenclature system. Indicate stereochemistry (if any) and label the hydroxy groups as primary, secondary, or tertiary. OH Br OH (a) CH;CH,CHCH; (b)...
-
A NON-RESIDENT alien is your client. Assume his country does not have a tax treaty with the USA. He expresses an interest in buying an apartment building in College Park to rent to students of the...
-
The owner of a chain of fast-food sit-down restaurants has hired your company to design a method to get orders to customers faster, with less labor, but without any loss of quality. Currently, the...
-
Designing interface screens for B2C and B2B Web sites is considered by some to have a fundamentally different objective compared with other types of interface screens. Specifically, the purpose of...
-
The last step in conducting the object-oriented analysis is organizing the objects and identifying their relationships. a. Does a class diagram show the structure of a system as dynamic or static? b....
-
Consider the TV. What makes it so easy to use? (Almost everybody seems able to watch it.) If you were to redesign anything, what would it be, and how would you redesign it?
-
Introspect on your own strengths and weaknesses. ( a ) Take a moment and relish something positive about yourself. ( b ) Identify a specific action you can take to address a weakness that you have,...
-
30: Accounts Payable Factory Building Cash Contributed Capital Equipment Transaction $ 21,000 103,300 29,300 191,000 129,000 During the month of July, the company had the following transactions: a...
-
a. What is meant by the term tax haven? b. What are the desired characteristics for a country if it expects to be used as a tax haven? c. What are the advantages leading an MNE to use a tax haven...
-
The three major inputs into the manufacturing process are direct materials, direct labour and factory overheads. If the costs of any of these are not controlled, they may inflate the cost of...
-
Listed below are selected financial data from the accounting records of Innovative Computers Pty Ltd for the year ended 30 June 2019. Required (a) Prepare an income statement for the year ended 30...
-
Smart Manufacturing Systems Pty Ltd provides the following information. Required (a) Calculate total manufacturing costs for the period ending 30 June 2019. (b) Calculate cost of goods manufactured...

Study smarter with the SolutionInn App