

The graph shows an individual labor supply curve. Use the graph to answer the questions. 1. Between
Question:
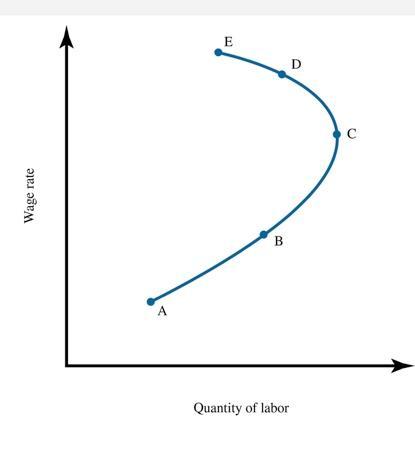
The graph shows an individual labor supply curve. Use the graph to answer the questions.
1. Between which two points on the graph does the income effect outweigh the substitution effect?
a. D and E
b. B and C
c. C and E
d. A and C
2. Between which two points on the graph does the substitution effect outweigh the income effect?
a. B and C
b. A and C
c. D and E
d. C and E
Although individual labor supply curves, such as the one shown, can be backward bending, the market labor supply curve will tend to be upward sloping across all wage rates.
3.This is because
a. the substitution effect tends to dominate at the market level.
b. diseconomies of scale dominate the income effect at market level.
c. higher wage rates will draw more people into a given market.
d. economies of scale dominate the substitution effect at market level.
Expert Answer:
Answer 1 The correct answer is option C ie C and E Explanation In the region between C and E we can ... View the full answer

