

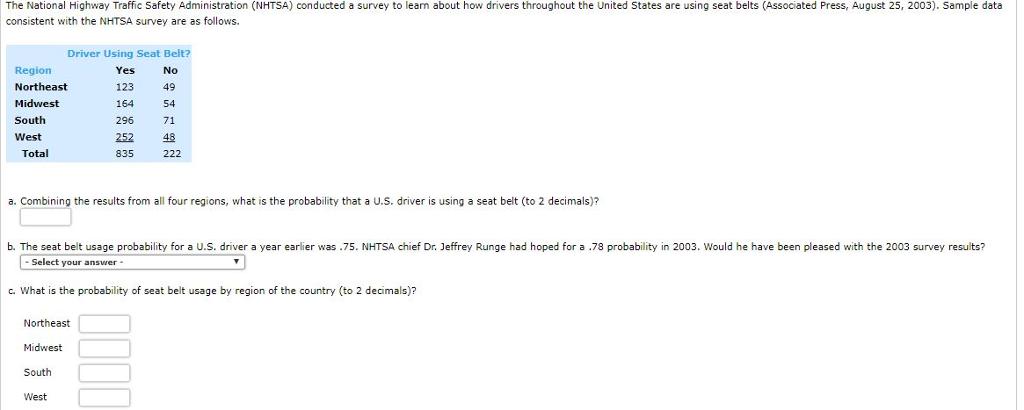
The National Highway Traffic Safety Administration (NHTSA) conducted a survey to leam about how drivers throughout...
Fantastic news! We've Found the answer you've been seeking!
Question:
Expert Answer:

Related Book For 

Posted Date:
