

The spreadsheet Group Report Data.xlsx contains monthly returns on ten Australian industry indices from January 2016...
Fantastic news! We've Found the answer you've been seeking!
Question:
Transcribed Image Text:
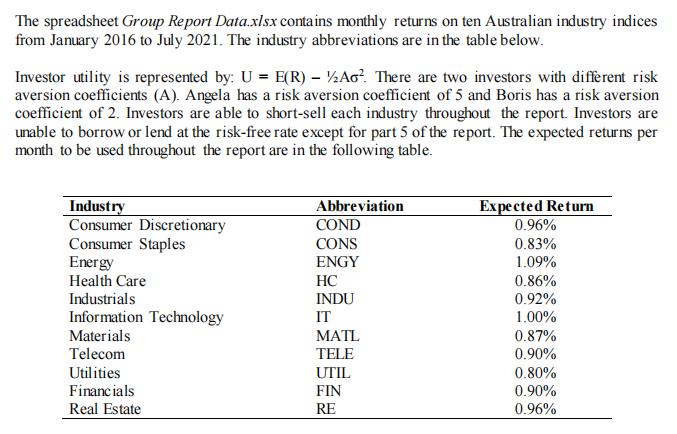
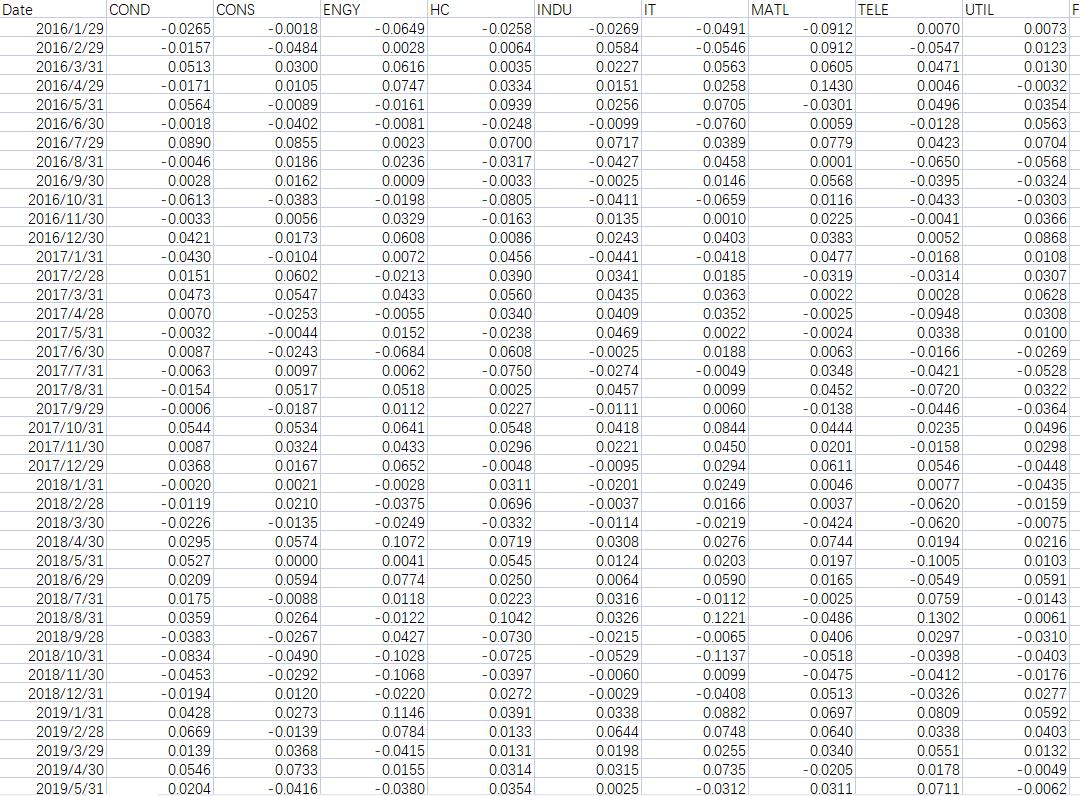
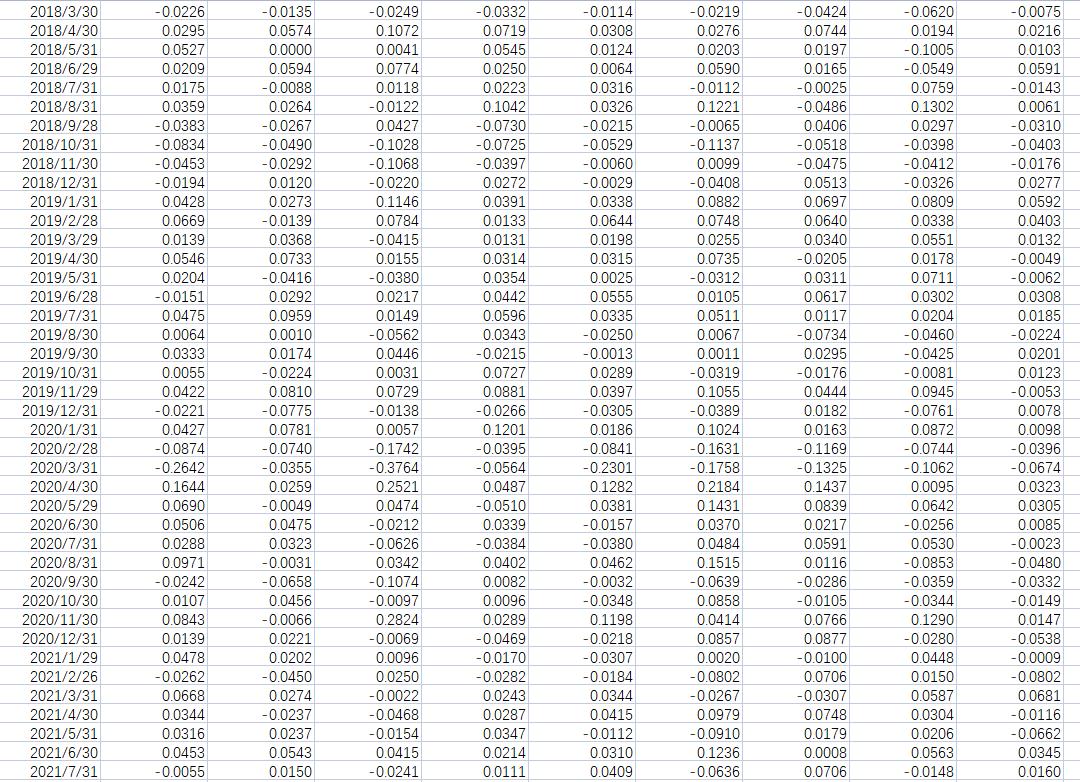
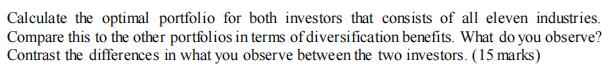
The spreadsheet Group Report Data.xlsx contains monthly returns on ten Australian industry indices from January 2016 to July 2021. The industry abbreviations are in the table below. Investor utility is represented by: U = E(R) – ½Ao?. There are two investors with diffèrent risk aversion coefficients (A). Angela has a risk aversion coefficient of 5 and Boris has a risk aversion coefficient of 2. Investors are able to short-sell each industry throughout the report. Investors are unable to borrow or lend at the risk-free rate except for part 5 of the report. The expected returns per month to be used throughout the report are in the following table. Industry Consumer Discretionary Consumer Staples Energy Abbreviation COND Expected Return 0.96% CONS 0.83% ENGY 1.09% Health Care HC 0.86% Industrials INDU 0.92% Information Technology IT 1.00% Materials МATL 0.87% 0.90% Telecom TELE Utilities UTIL 0.80% Financials FIN 0.90% Real Estate RE 0.96% Date COND CONS ENGY HC INDU IT MATL TELE UTIL -0.0018 -0.0649 -0.0912 0.0073 0.0123 2016/1/29 -0.0265 -0.0258 -0.0269 -0.0491 0.0070 2016/2/29 -0.0157 -0.0484 0.0028 0.0064 0.0584 -0.0546 0.0912 -0.0547 2016/3/31 0.0513 0.0300 0.0616 0.0035 0.0227 0.0563 0.0605 0.0471 0.0130 0.0747 0.0151 0.0256 2016/4/29 -0.0171 0.0105 0.0334 0.0258 0.1430 0.0046 -0.0032 2016/5/31 0.0564 -0.0089 -0.0161 0.0939 0.0705 -0.0301 0.0496 0.0354 2016/6/30 -0.0018 -0.0402 -0.0081 -0.0248 -0.0099 -0.0760 0.0059 -0.0128 0.0563 2016/7/29 0.0890 0.0855 0.0023 0.0700 0.0717 0.0389 0.0779 0.0423 0.0704 -0.0046 -0.0317 -0.0427 -0.0025 2016/8/31 0.0186 0.0236 0.0458 0.0001 -0.0650 -0.0568 0.0028 -0.0613 0.0009 0.0568 0.0116 2016/9/30 0.0162 -0.0033 0.0146 -0.0395 -0.0324 -0.0303 0.0366 -0.0383 -0.0198 -0.0805 -0.0163 2016/10/31 -0.0411 -0.0659 -0.0433 -0.0033 0.0421 -0.0430 2016/11/30 0.0135 0.0243 0.0056 0.0329 0.0010 0.0225 -0.0041 2016/12/30 0.0173 0.0608 0.0086 0.0403 0.0383 0.0052 0.0868 0.0456 0.0477 -0.0319 2017/1/31 -0.0104 0.0072 -0.0441 -0.0418 -0.0168 0.0108 0.0307 -0.0314 0.0028 0.0151 0.0341 0.0435 2017/2/28 0.0602 -0.0213 0.0390 0.0185 2017/3/31 0.0473 0.0547 0.0433 0.0560 0.0363 0.0022 0.0628 2017/4/28 0.0070 -0.0253 -0.0055 0.0340 0.0409 0.0352 -0.0025 -0.0948 0.0308 0.0152 -0.0684 2017/5/31 -0.0032 -0.0044 -0.0238 0.0469 0.0022 -0.0024 0.0338 0.0100 2017/6/30 0.0087 -0.0243 0.0063 -0.0269 0.0608 -0.0750 -0.0025 0.0188 -0.0166 2017/7/31 -0.0063 0.0097 0.0062 -0.0274 -0.0049 0.0348 -0.0421 -0.0528 0.0518 0.0099 0.0457 -0.0111 2017/8/31 -0.0154 0.0517 0.0025 0.0452 -0.0720 0.0322 2017/9/29 0.0060 -0.0138 0.0444 -0.0446 -0.0006 0.0544 0.0087 -0.0187 0.0112 0.0227 -0.0364 2017/10/31 0.0534 0.0641 0.0548 0.0418 0.0844 0.0235 0.0496 2017/11/30 0.0324 0.0433 0.0296 0.0221 0.0450 0.0201 -0.0158 0.0298 2017/12/29 0.0368 0.0167 0.0021 0.0210 0.0652 -0.0048 -0.0095 0.0294 0.0611 0.0546 -0.0448 -0.0020 -0.0119 2018/1/31 -0.0028 0.0311 -0.0201 0.0249 0.0046 0.0077 -0.0435 2018/2/28 -0.0375 0.0696 -0.0037 0.0166 0.0037 -0.0620 -0.0159 -0.0620 -0.0114 0.0308 0.0124 -0.0424 0.0744 2018/3/30 -0.0226 -0.0135 -0.0249 -0.0332 -0.0219 -0.0075 0.1072 0.0041 0.0295 0.0574 0.0719 0.0545 2018/4/30 0.0276 0.0194 0.0216 0.0527 0.0209 0.0197 0.0165 2018/5/31 0.0000 0.0203 -0.1005 0.0103 0.0591 -0.0143 0.0061 2018/6/29 0.0594 0.0774 0.0250 0.0064 0.0590 -0.0549 0.0759 0.0175 0.0359 2018/7/31 -0.0088 0.0118 0.0223 0.0316 -0.0112 -0.0025 2018/8/31 0.0264 -0.0122 0.1042 0.0326 0.1221 -0.0486 0.1302 2018/9/28 -0.0383 -0.0267 0.0427 -0.0730 -0.0215 -0.0065 0.0406 0.0297 -0.0310 -0.0834 -0.1028 -0.0529 -0.1137 0.0099 2018/10/31 -0.0490 -0.0725 -0.0518 -0.0398 -0.0403 2018/11/30 -0.0453 -0.0292 -0.1068 -0.0397 -0.0060 -0.0475 -0.0412 -0.0176 2018/12/31 -0.0194 0.0120 -0.0220 0.0272 0.0513 -0.0326 -0.0029 0.0338 -0.0408 0.0277 2019/1/31 0.0428 0.0273 0.1146 0.0391 0.0882 0.0697 0.0809 0.0592 0.0644 0.0198 0.0403 0.0669 0.0139 2019/2/28 -0.0139 0.0784 0.0133 0.0748 0.0640 0.0338 2019/3/29 0.0368 -0.0415 0.0131 0.0255 0.0340 0.0551 0.0132 2019/4/30 0.0546 0.0733 0.0155 0.0314 0.0315 0.0735 -0.0205 0.0178 -0.0049 2019/5/31 0.0204 -0.0416 -0.0380 0.0354 0.0025 -0.0312 0.0311 0.0711 -0.0062 -0.0332 -0.0620 -0.0135 0.0574 -0.0424 0.0744 0.0197 2018/3/30 -0.0226 -0.0249 -0.0114 -0.0219 -0.0075 0.0719 0.0194 -0.1005 2018/4/30 0.0295 0.1072 0.0308 0.0276 0.0216 2018/5/31 0.0527 0.0000 0.0041 0.0545 0.0124 0.0203 0.0103 0.0774 0.0118 0.0250 0.0064 0.0165 -0.0025 -0.0486 2018/6/29 0.0209 0.0594 0.0590 -0.0549 0.0591 2018/7/31 2018/8/31 0.0175 -0.0112 0.1221 -0.0088 0.0223 0.0316 0.0759 -0.0143 0.0359 0.0264 -0.0122 0.1042 0.0326 0.1302 0.0061 2018/9/28 -0.0383 -0.0267 0.0427 -0.0730 -0.0215 -0.0065 0.0406 0.0297 -0.0310 2018/10/31 -0.0834 -0.0490 -0.1028 -0.0725 -0.0529 -0.1137 -0.0518 -0.0398 -0.0403 2018/11/30 -0.0453 -0.0292 -0.1068 -0.0397 -0.0060 0.0099 -0.0475 -0.0412 -0.0176 2018/12/31 0.0120 -0.0220 -0.0029 0.0338 0.0644 -0.0194 0.0272 -0.0408 0.0513 -0.0326 0.0277 0.1146 0.0784 2019/1/31 0.0428 0.0273 0.0391 0.0882 0.0697 0.0809 0.0592 2019/2/28 0.0669 -0.0139 0.0133 0.0748 0.0640 0.0338 0.0403 2019/3/29 0.0139 0.0255 0.0340 0.0132 0.0368 0.0733 -0.0415 0.0131 0.0198 0.0551 2019/4/30 0.0546 0.0155 0.0314 0.0315 0.0735 -0.0205 0.0178 -0.0049 2019/5/31 0.0204 -0.0416 0.0292 -0.0380 0.0354 0.0025 -0.0312 0.0711 -0.0062 0.0311 0.0617 0.0442 0.0596 2019/6/28 -0.0151 0.0217 0.0555 0.0105 0.0302 0.0308 0.0204 -0.0460 2019/7/31 0.0475 0.0959 0.0149 0.0335 0.0511 0.0117 0.0185 2019/8/30 0.0064 0.0010 -0.0562 0.0343 -0.0250 0.0067 -0.0734 -0.0224 2019/9/30 0.0333 0.0174 0.0446 -0.0215 -0.0013 0.0011 0.0295 -0.0425 0.0201 2019/10/31 0.0055 -0.0224 0.0031 0.0727 0.0289 -0.0319 -0.0176 -0.0081 0.0123 0.1055 -0.0389 2019/11/29 0.0422 0.0810 0.0729 0.0881 0.0397 0.0444 0.0945 -0.0053 2019/12/31 -0.0221 -0.0775 -0.0138 -0.0266 -0.0305 0.0182 -0.0761 0.0078 2020/1/31 0.0427 0.0781 0.0057 0.1201 0.0186 0.1024 0.0163 0.0872 0.0098 -0.0874 -0.2642 0.1644 -0.0740 -0.0355 0.0259 -0.1742 -0.3764 0.2521 -0.0395 -0.0564 -0.0744 -0.1062 -0.0841 -0.1631 -0.1169 -0.1325 2020/2/28 -0.0396 -0.0674 0.0323 2020/3/31 -0.2301 -0.1758 2020/4/30 0.0487 0.1282 0.2184 0.1437 0.0095 0.0642 -0.0256 2020/5/29 0.0690 -0.0049 0.0474 -0.0510 0.0381 0.1431 0.0839 0.0305 0.0339 -0.0384 2020/6/30 0.0506 0.0475 -0.0212 -0.0157 0.0370 0.0217 0.0085 0.0484 0.0591 0.0116 2020/7/31 0.0288 0.0323 -0.0626 0.0342 -0.0380 0.0530 -0.0023 2020/8/31 0.0971 -0.0031 0.0402 0.0462 0.1515 -0.0853 -0.0480 2020/9/30 -0.0242 -0.0658 -0.1074 0.0082 -0.0032 -0.0639 -0.0286 -0.0359 -0.0332 2020/10/30 0.0107 0.0456 -0.0097 0.0096 -0.0348 0.0858 -0.0105 -0.0344 -0.0149 2020/11/30 0.0843 -0.0066 0.2824 0.0289 0.1198 0.0414 0.0766 0.1290 0.0147 2020/12/31 0.0139 0.0221 -0.0069 -0.0469 -0.0218 0.0857 0.0877 -0.0280 -0.0538 2021/1/29 0.0478 0.0202 0.0096 -0.0170 -0.0307 0.0020 -0.0100 0.0448 -0.0009 2021/2/26 -0.0262 -0.0450 0.0250 -0.0282 -0.0184 -0.0802 0.0706 -0.0307 0.0150 -0.0802 2021/3/31 0.0668 0.0274 -0.0022 0.0243 0.0344 -0.0267 0.0587 0.0681 0.0748 0.0179 2021/4/30 -0.0237 -0.0468 -0.0154 0.0344 0.0304 0.0287 0.0347 0.0415 0.0979 -0.0116 2021/5/31 0.0316 0.0237 -0.0112 -0.0910 0.0206 -0.0662 2021/6/30 0.0453 0.0543 0.0415 0.0214 0.0310 0.1236 0.0008 0.0563 0.0345 2021/7/31 -0.0055 0.0150 -0.0241 0.0111 0.0409 -0.0636 0.0706 -0.0148 0.0160 Calculate the optimal portfolio for both investors that consists of all eleven industries. Compare this to the other portfolios in terms of diversification benefits. What do you observe? Contrast the differences in what you observe between the two investors. (15 marks) The spreadsheet Group Report Data.xlsx contains monthly returns on ten Australian industry indices from January 2016 to July 2021. The industry abbreviations are in the table below. Investor utility is represented by: U = E(R) – ½Ao?. There are two investors with diffèrent risk aversion coefficients (A). Angela has a risk aversion coefficient of 5 and Boris has a risk aversion coefficient of 2. Investors are able to short-sell each industry throughout the report. Investors are unable to borrow or lend at the risk-free rate except for part 5 of the report. The expected returns per month to be used throughout the report are in the following table. Industry Consumer Discretionary Consumer Staples Energy Abbreviation COND Expected Return 0.96% CONS 0.83% ENGY 1.09% Health Care HC 0.86% Industrials INDU 0.92% Information Technology IT 1.00% Materials МATL 0.87% 0.90% Telecom TELE Utilities UTIL 0.80% Financials FIN 0.90% Real Estate RE 0.96% Date COND CONS ENGY HC INDU IT MATL TELE UTIL -0.0018 -0.0649 -0.0912 0.0073 0.0123 2016/1/29 -0.0265 -0.0258 -0.0269 -0.0491 0.0070 2016/2/29 -0.0157 -0.0484 0.0028 0.0064 0.0584 -0.0546 0.0912 -0.0547 2016/3/31 0.0513 0.0300 0.0616 0.0035 0.0227 0.0563 0.0605 0.0471 0.0130 0.0747 0.0151 0.0256 2016/4/29 -0.0171 0.0105 0.0334 0.0258 0.1430 0.0046 -0.0032 2016/5/31 0.0564 -0.0089 -0.0161 0.0939 0.0705 -0.0301 0.0496 0.0354 2016/6/30 -0.0018 -0.0402 -0.0081 -0.0248 -0.0099 -0.0760 0.0059 -0.0128 0.0563 2016/7/29 0.0890 0.0855 0.0023 0.0700 0.0717 0.0389 0.0779 0.0423 0.0704 -0.0046 -0.0317 -0.0427 -0.0025 2016/8/31 0.0186 0.0236 0.0458 0.0001 -0.0650 -0.0568 0.0028 -0.0613 0.0009 0.0568 0.0116 2016/9/30 0.0162 -0.0033 0.0146 -0.0395 -0.0324 -0.0303 0.0366 -0.0383 -0.0198 -0.0805 -0.0163 2016/10/31 -0.0411 -0.0659 -0.0433 -0.0033 0.0421 -0.0430 2016/11/30 0.0135 0.0243 0.0056 0.0329 0.0010 0.0225 -0.0041 2016/12/30 0.0173 0.0608 0.0086 0.0403 0.0383 0.0052 0.0868 0.0456 0.0477 -0.0319 2017/1/31 -0.0104 0.0072 -0.0441 -0.0418 -0.0168 0.0108 0.0307 -0.0314 0.0028 0.0151 0.0341 0.0435 2017/2/28 0.0602 -0.0213 0.0390 0.0185 2017/3/31 0.0473 0.0547 0.0433 0.0560 0.0363 0.0022 0.0628 2017/4/28 0.0070 -0.0253 -0.0055 0.0340 0.0409 0.0352 -0.0025 -0.0948 0.0308 0.0152 -0.0684 2017/5/31 -0.0032 -0.0044 -0.0238 0.0469 0.0022 -0.0024 0.0338 0.0100 2017/6/30 0.0087 -0.0243 0.0063 -0.0269 0.0608 -0.0750 -0.0025 0.0188 -0.0166 2017/7/31 -0.0063 0.0097 0.0062 -0.0274 -0.0049 0.0348 -0.0421 -0.0528 0.0518 0.0099 0.0457 -0.0111 2017/8/31 -0.0154 0.0517 0.0025 0.0452 -0.0720 0.0322 2017/9/29 0.0060 -0.0138 0.0444 -0.0446 -0.0006 0.0544 0.0087 -0.0187 0.0112 0.0227 -0.0364 2017/10/31 0.0534 0.0641 0.0548 0.0418 0.0844 0.0235 0.0496 2017/11/30 0.0324 0.0433 0.0296 0.0221 0.0450 0.0201 -0.0158 0.0298 2017/12/29 0.0368 0.0167 0.0021 0.0210 0.0652 -0.0048 -0.0095 0.0294 0.0611 0.0546 -0.0448 -0.0020 -0.0119 2018/1/31 -0.0028 0.0311 -0.0201 0.0249 0.0046 0.0077 -0.0435 2018/2/28 -0.0375 0.0696 -0.0037 0.0166 0.0037 -0.0620 -0.0159 -0.0620 -0.0114 0.0308 0.0124 -0.0424 0.0744 2018/3/30 -0.0226 -0.0135 -0.0249 -0.0332 -0.0219 -0.0075 0.1072 0.0041 0.0295 0.0574 0.0719 0.0545 2018/4/30 0.0276 0.0194 0.0216 0.0527 0.0209 0.0197 0.0165 2018/5/31 0.0000 0.0203 -0.1005 0.0103 0.0591 -0.0143 0.0061 2018/6/29 0.0594 0.0774 0.0250 0.0064 0.0590 -0.0549 0.0759 0.0175 0.0359 2018/7/31 -0.0088 0.0118 0.0223 0.0316 -0.0112 -0.0025 2018/8/31 0.0264 -0.0122 0.1042 0.0326 0.1221 -0.0486 0.1302 2018/9/28 -0.0383 -0.0267 0.0427 -0.0730 -0.0215 -0.0065 0.0406 0.0297 -0.0310 -0.0834 -0.1028 -0.0529 -0.1137 0.0099 2018/10/31 -0.0490 -0.0725 -0.0518 -0.0398 -0.0403 2018/11/30 -0.0453 -0.0292 -0.1068 -0.0397 -0.0060 -0.0475 -0.0412 -0.0176 2018/12/31 -0.0194 0.0120 -0.0220 0.0272 0.0513 -0.0326 -0.0029 0.0338 -0.0408 0.0277 2019/1/31 0.0428 0.0273 0.1146 0.0391 0.0882 0.0697 0.0809 0.0592 0.0644 0.0198 0.0403 0.0669 0.0139 2019/2/28 -0.0139 0.0784 0.0133 0.0748 0.0640 0.0338 2019/3/29 0.0368 -0.0415 0.0131 0.0255 0.0340 0.0551 0.0132 2019/4/30 0.0546 0.0733 0.0155 0.0314 0.0315 0.0735 -0.0205 0.0178 -0.0049 2019/5/31 0.0204 -0.0416 -0.0380 0.0354 0.0025 -0.0312 0.0311 0.0711 -0.0062 -0.0332 -0.0620 -0.0135 0.0574 -0.0424 0.0744 0.0197 2018/3/30 -0.0226 -0.0249 -0.0114 -0.0219 -0.0075 0.0719 0.0194 -0.1005 2018/4/30 0.0295 0.1072 0.0308 0.0276 0.0216 2018/5/31 0.0527 0.0000 0.0041 0.0545 0.0124 0.0203 0.0103 0.0774 0.0118 0.0250 0.0064 0.0165 -0.0025 -0.0486 2018/6/29 0.0209 0.0594 0.0590 -0.0549 0.0591 2018/7/31 2018/8/31 0.0175 -0.0112 0.1221 -0.0088 0.0223 0.0316 0.0759 -0.0143 0.0359 0.0264 -0.0122 0.1042 0.0326 0.1302 0.0061 2018/9/28 -0.0383 -0.0267 0.0427 -0.0730 -0.0215 -0.0065 0.0406 0.0297 -0.0310 2018/10/31 -0.0834 -0.0490 -0.1028 -0.0725 -0.0529 -0.1137 -0.0518 -0.0398 -0.0403 2018/11/30 -0.0453 -0.0292 -0.1068 -0.0397 -0.0060 0.0099 -0.0475 -0.0412 -0.0176 2018/12/31 0.0120 -0.0220 -0.0029 0.0338 0.0644 -0.0194 0.0272 -0.0408 0.0513 -0.0326 0.0277 0.1146 0.0784 2019/1/31 0.0428 0.0273 0.0391 0.0882 0.0697 0.0809 0.0592 2019/2/28 0.0669 -0.0139 0.0133 0.0748 0.0640 0.0338 0.0403 2019/3/29 0.0139 0.0255 0.0340 0.0132 0.0368 0.0733 -0.0415 0.0131 0.0198 0.0551 2019/4/30 0.0546 0.0155 0.0314 0.0315 0.0735 -0.0205 0.0178 -0.0049 2019/5/31 0.0204 -0.0416 0.0292 -0.0380 0.0354 0.0025 -0.0312 0.0711 -0.0062 0.0311 0.0617 0.0442 0.0596 2019/6/28 -0.0151 0.0217 0.0555 0.0105 0.0302 0.0308 0.0204 -0.0460 2019/7/31 0.0475 0.0959 0.0149 0.0335 0.0511 0.0117 0.0185 2019/8/30 0.0064 0.0010 -0.0562 0.0343 -0.0250 0.0067 -0.0734 -0.0224 2019/9/30 0.0333 0.0174 0.0446 -0.0215 -0.0013 0.0011 0.0295 -0.0425 0.0201 2019/10/31 0.0055 -0.0224 0.0031 0.0727 0.0289 -0.0319 -0.0176 -0.0081 0.0123 0.1055 -0.0389 2019/11/29 0.0422 0.0810 0.0729 0.0881 0.0397 0.0444 0.0945 -0.0053 2019/12/31 -0.0221 -0.0775 -0.0138 -0.0266 -0.0305 0.0182 -0.0761 0.0078 2020/1/31 0.0427 0.0781 0.0057 0.1201 0.0186 0.1024 0.0163 0.0872 0.0098 -0.0874 -0.2642 0.1644 -0.0740 -0.0355 0.0259 -0.1742 -0.3764 0.2521 -0.0395 -0.0564 -0.0744 -0.1062 -0.0841 -0.1631 -0.1169 -0.1325 2020/2/28 -0.0396 -0.0674 0.0323 2020/3/31 -0.2301 -0.1758 2020/4/30 0.0487 0.1282 0.2184 0.1437 0.0095 0.0642 -0.0256 2020/5/29 0.0690 -0.0049 0.0474 -0.0510 0.0381 0.1431 0.0839 0.0305 0.0339 -0.0384 2020/6/30 0.0506 0.0475 -0.0212 -0.0157 0.0370 0.0217 0.0085 0.0484 0.0591 0.0116 2020/7/31 0.0288 0.0323 -0.0626 0.0342 -0.0380 0.0530 -0.0023 2020/8/31 0.0971 -0.0031 0.0402 0.0462 0.1515 -0.0853 -0.0480 2020/9/30 -0.0242 -0.0658 -0.1074 0.0082 -0.0032 -0.0639 -0.0286 -0.0359 -0.0332 2020/10/30 0.0107 0.0456 -0.0097 0.0096 -0.0348 0.0858 -0.0105 -0.0344 -0.0149 2020/11/30 0.0843 -0.0066 0.2824 0.0289 0.1198 0.0414 0.0766 0.1290 0.0147 2020/12/31 0.0139 0.0221 -0.0069 -0.0469 -0.0218 0.0857 0.0877 -0.0280 -0.0538 2021/1/29 0.0478 0.0202 0.0096 -0.0170 -0.0307 0.0020 -0.0100 0.0448 -0.0009 2021/2/26 -0.0262 -0.0450 0.0250 -0.0282 -0.0184 -0.0802 0.0706 -0.0307 0.0150 -0.0802 2021/3/31 0.0668 0.0274 -0.0022 0.0243 0.0344 -0.0267 0.0587 0.0681 0.0748 0.0179 2021/4/30 -0.0237 -0.0468 -0.0154 0.0344 0.0304 0.0287 0.0347 0.0415 0.0979 -0.0116 2021/5/31 0.0316 0.0237 -0.0112 -0.0910 0.0206 -0.0662 2021/6/30 0.0453 0.0543 0.0415 0.0214 0.0310 0.1236 0.0008 0.0563 0.0345 2021/7/31 -0.0055 0.0150 -0.0241 0.0111 0.0409 -0.0636 0.0706 -0.0148 0.0160 Calculate the optimal portfolio for both investors that consists of all eleven industries. Compare this to the other portfolios in terms of diversification benefits. What do you observe? Contrast the differences in what you observe between the two investors. (15 marks)
Expert Answer:
Answer rating: 100% (QA)
Answer i Industries with the highest utility will have a better return risk tradeoff ii Based on this reason we can select the highest utility industr... View the full answer

Related Book For 

Data Analysis and Decision Making
ISBN: 978-0538476126
4th edition
Authors: Christian Albright, Wayne Winston, Christopher Zappe
Posted Date:
Students also viewed these finance questions
-
A bank can borrow or lend at LIBOR. The two-month LIBOR rate is 0.28% per annum with continuous compounding. Assuming that interest rates cannot be negative, what is the arbitrage opportunity if the...
-
A bank can borrow or lend at LIBOR. Suppose that the six-month rate is 5% and the nine-month rate is 6%. The rate that can be locked in for the period between six months and nine months using an FRA...
-
The file S02_41.xlsx contains monthly returns on Barnes and Noble stock for several years. As the formulas in the file indicate, each return is the percentage change in the adjusted closing price...
-
Bloomberg Intelligence listed 50 companies to watch in 2018 (www .bloomberg.com/features/companies-to-watch-2018). Twelve of the companies are listed here with their total assets and 12-month sales....
-
We are continually hearing reports on the nightly news about natural disastersdroughts in Texas, hurricanes in Florida, floods in California, and so on. We often hear that one of these was the worst...
-
Convert each of the following IR frequencies into micrometers. (a) 1720 cm-1 (C=0) (b) 1650 cm-1 (C=C) (c) 3300 cm-1 (O-H) (d) 890 cm-1 (alkene bend) (e) 1100 cm-1 (C-O) (f) 2260 cm-1 (C=N)
-
Thomas and James, who were operating separate competing businesses, decided on 1 July 2025 to form a partnership by contributing cash, assets and liabilities of their respective businesses. At that...
-
You are working with William Bond, CPA, and you are considering the risk of material misstatement in planning the audit of Toxic Waste Disposal (TWD) Companys financial statements for the year ended...
-
6. Given below are the oxides : Na2O, As2O3, N2O, NO and ChO7 Number of amphoteric oxides is: (a) 0 (b) 1 7. Match List -I with List - II: List-I List-II (A) Sphalerite (I) FeCO3 (B) Calamine (II)...
-
Nielsen Media Research provides two measures of the television viewing audience: a television program rating, which is the percentage of households with televisions watching a program, and a...
-
The plan and profile views of a pollution source and surroundings are given below. For an emissions rate of 165.0 g/s, Class D stability, rough terrain, and a wind speed of 7 m/s (at 10 m), calculate...
-
The impact of Covid-19 on the economy is estimated to be very large. To combat the negative impact on the economy, the Australian government implemented a fiscal stimulus package worth more than 10...
-
Will online retailers continue to gain market share from large U.S. brick-and-mortar department store chains over the next few years?
-
What is impact to taxable income based on method of accounting ?
-
delivery of loans it purchases under its Farmer Mac I and II programs. Explain its pricing relative to its interest rate risk for these different delivery periods. (How does its required net yield...
-
What was significant about the launch of Wells Fargo online banking?
-
A single-degree-of-freedom system has a mass of 50 kg, spring stiffness of 500 N/m and viscous damping of 30 N-/m. The floor supporting the mass (via the spring and damperi has a harmonic motion with...
-
Propose a reasonable mechanism for the following reaction. OH
-
The file S02_21.xlsx contains monthly interest rates on 30-year fixed-rate mortgages in the United States from 1977 to 2009. The file also contains rates on15-year fixed-rate mortgages from late 1991...
-
The file S03_65.xlsx lists a lot of data for each NBA team for the seasons 20042005 to 20082009. The variables are divided into groups: (1) Overall success, (2) Offensive, and (3) Defensive. The...
-
The CEO of a medical supply company is committed to expanding the proportion of highly qualified women in the organizations staff of salespersons. He claims that the proportion of women in similar...
-
What is an antigen?
-
Why is a single innate immune cell able to respond to many different pathogens?
-
Explain what happens when a B cell first encounters a pathogen and binds to an antigen on the pathogen.

Study smarter with the SolutionInn App