

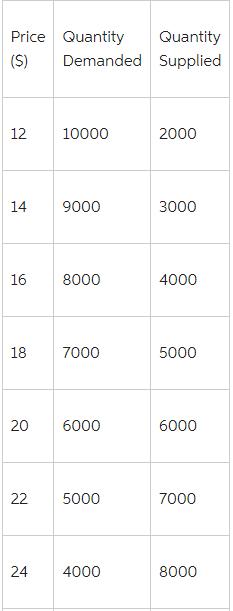
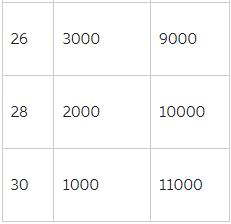
The table below shows the market supply and demand schedules for Cheesecakes: see the table and...
Fantastic news! We've Found the answer you've been seeking!
Question:

Transcribed Image Text:
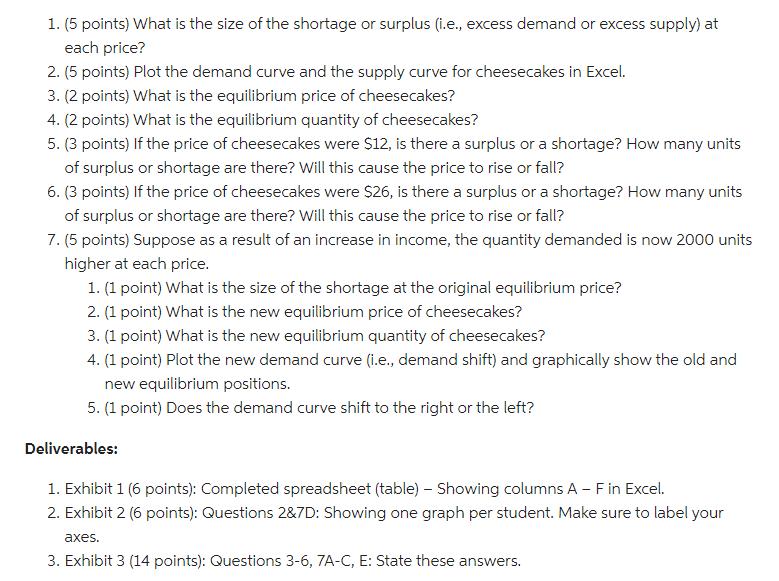
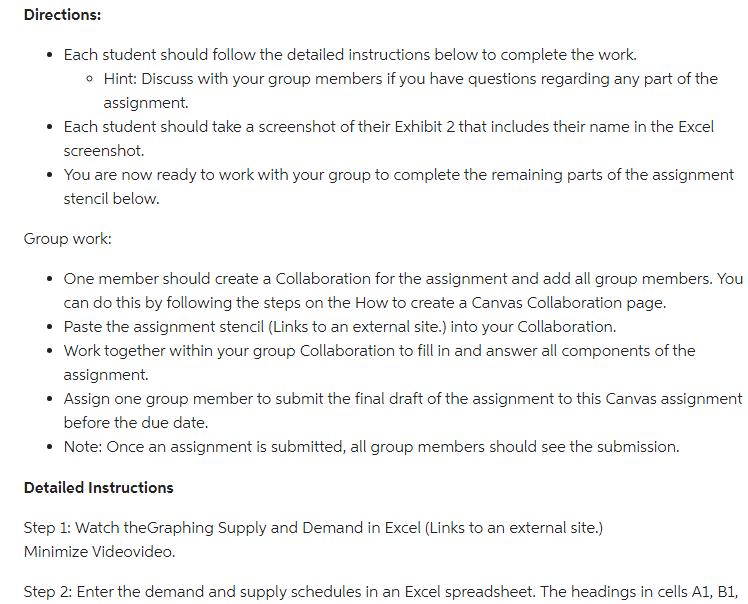
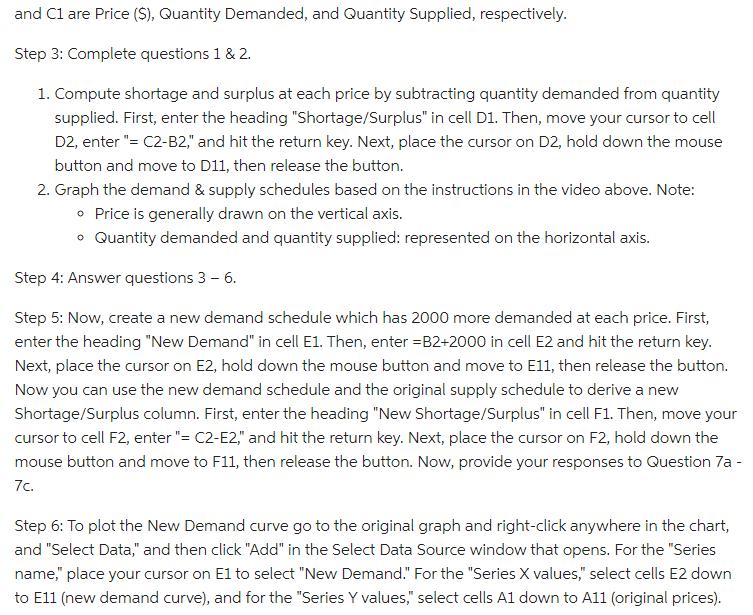
The table below shows the market supply and demand schedules for Cheesecakes: see the table and answer the following questions Price (S) 12 14 16 18 20 22 24 Quantity Demanded 10000 9000 8000 7000 6000 5000 4000 Quantity Supplied 2000 3000 4000 5000 6000 7000 8000 26 28 30 3000 2000 1000 9000 10000 11000 1. (5 points) What is the size of the shortage or surplus (i.e., excess demand or excess supply) at each price? 2. (5 points) Plot the demand curve and the supply curve for cheesecakes in Excel. 3. (2 points) What is the equilibrium price of cheesecakes? 4. (2 points) What is the equilibrium quantity of cheesecakes? 5. (3 points) If the price of cheesecakes were $12, is there a surplus or a shortage? How many units of surplus or shortage are there? Will this cause the price to rise or fall? 6. (3 points) If the price of cheesecakes were $26, is there a surplus or a shortage? How many units of surplus or shortage are there? Will this cause the price to rise or fall? 7. (5 points) Suppose as a result of an increase in income, the quantity demanded is now 2000 units higher at each price. 1. (1 point) What is the size of the shortage at the original equilibrium price? 2. (1 point) What is the new equilibrium price of cheesecakes? 3. (1 point) What is the new equilibrium quantity of cheesecakes? 4. (1 point) Plot the new demand curve (i.e., demand shift) and graphically show the old and new equilibrium positions. 5. (1 point) Does the demand curve shift to the right or the left? Deliverables: 1. Exhibit 1 (6 points): Completed spreadsheet (table) - Showing columns A - F in Excel. 2. Exhibit 2 (6 points): Questions 2&7D: Showing one graph per student. Make sure to label your axes. 3. Exhibit 3 (14 points): Questions 3-6, 7A-C, E: State these answers. Directions: • Each student should follow the detailed instructions below to complete the work. • Hint: Discuss with your group members if you have questions regarding any part of the assignment. • Each student should take a screenshot of their Exhibit 2 that includes their name in the Excel screenshot. • You are now ready to work with your group to complete the remaining parts of the assignment stencil below. Group work: • One member should create a Collaboration for the assignment and add all group members. You can do this by following the steps on the How to create a Canvas Collaboration page. • Paste the assignment stencil (Links to an external site.) into your Collaboration. • Work together within your group Collaboration to fill in and answer all components of the assignment. • Assign one group member to submit the final draft of the assignment to this Canvas assignment before the due date. • Note: Once an assignment is submitted, all group members should see the submission. Detailed Instructions Step 1: Watch theGraphing Supply and Demand in Excel (Links to an external site.) Minimize Videovideo. Step 2: Enter the demand and supply schedules in an Excel spreadsheet. The headings in cells A1, B1, and C1 are Price ($), Quantity Demanded, and Quantity Supplied, respectively. Step 3: Complete questions 1 & 2. 1. Compute shortage and surplus at each price by subtracting quantity demanded from quantity supplied. First, enter the heading "Shortage/Surplus" in cell D1. Then, move your cursor to cell D2, enter"= C2-B2," and hit the return key. Next, place the cursor on D2, hold down the mouse button and move to D11, then release the button. 2. Graph the demand & supply schedules based on the instructions in the video above. Note: • Price is generally drawn on the vertical axis. • Quantity demanded and quantity supplied: represented on the horizontal axis. Step 4: Answer questions 3 - 6. Step 5: Now, create a new demand schedule which has 2000 more demanded at each price. First, enter the heading "New Demand" in cell E1. Then, enter =B2+2000 in cell E2 and hit the return key. Next, place the cursor on E2, hold down the mouse button and move to E11, then release the button. Now you can use the new demand schedule and the original supply schedule to derive a new Shortage/Surplus column. First, enter the heading "New Shortage/Surplus" in cell F1. Then, move your cursor to cell F2, enter"= C2-E2," and hit the return key. Next, place the cursor on F2, hold down the mouse button and move to F11, then release the button. Now, provide your responses to Question 7a - 7c. Step 6: To plot the New Demand curve go to the original graph and right-click anywhere in the chart, and "Select Data," and then click "Add" in the Select Data Source window that opens. For the "Series name," place your cursor on E1 to select "New Demand." For the "Series X values," select cells E2 down to E11 (new demand curve), and for the "Series Y values," select cells A1 down to A11 (original prices). Now you have a graph showing all three curves. Step 7: Now, graphically show the old and new equilibrium positions. Step 8: Make sure to label your axes and the appropriate scales for each axis. For help: The table below shows the market supply and demand schedules for Cheesecakes: see the table and answer the following questions Price (S) 12 14 16 18 20 22 24 Quantity Demanded 10000 9000 8000 7000 6000 5000 4000 Quantity Supplied 2000 3000 4000 5000 6000 7000 8000 26 28 30 3000 2000 1000 9000 10000 11000 1. (5 points) What is the size of the shortage or surplus (i.e., excess demand or excess supply) at each price? 2. (5 points) Plot the demand curve and the supply curve for cheesecakes in Excel. 3. (2 points) What is the equilibrium price of cheesecakes? 4. (2 points) What is the equilibrium quantity of cheesecakes? 5. (3 points) If the price of cheesecakes were $12, is there a surplus or a shortage? How many units of surplus or shortage are there? Will this cause the price to rise or fall? 6. (3 points) If the price of cheesecakes were $26, is there a surplus or a shortage? How many units of surplus or shortage are there? Will this cause the price to rise or fall? 7. (5 points) Suppose as a result of an increase in income, the quantity demanded is now 2000 units higher at each price. 1. (1 point) What is the size of the shortage at the original equilibrium price? 2. (1 point) What is the new equilibrium price of cheesecakes? 3. (1 point) What is the new equilibrium quantity of cheesecakes? 4. (1 point) Plot the new demand curve (i.e., demand shift) and graphically show the old and new equilibrium positions. 5. (1 point) Does the demand curve shift to the right or the left? Deliverables: 1. Exhibit 1 (6 points): Completed spreadsheet (table) - Showing columns A - F in Excel. 2. Exhibit 2 (6 points): Questions 2&7D: Showing one graph per student. Make sure to label your axes. 3. Exhibit 3 (14 points): Questions 3-6, 7A-C, E: State these answers. Directions: • Each student should follow the detailed instructions below to complete the work. • Hint: Discuss with your group members if you have questions regarding any part of the assignment. • Each student should take a screenshot of their Exhibit 2 that includes their name in the Excel screenshot. • You are now ready to work with your group to complete the remaining parts of the assignment stencil below. Group work: • One member should create a Collaboration for the assignment and add all group members. You can do this by following the steps on the How to create a Canvas Collaboration page. • Paste the assignment stencil (Links to an external site.) into your Collaboration. • Work together within your group Collaboration to fill in and answer all components of the assignment. • Assign one group member to submit the final draft of the assignment to this Canvas assignment before the due date. • Note: Once an assignment is submitted, all group members should see the submission. Detailed Instructions Step 1: Watch theGraphing Supply and Demand in Excel (Links to an external site.) Minimize Videovideo. Step 2: Enter the demand and supply schedules in an Excel spreadsheet. The headings in cells A1, B1, and C1 are Price ($), Quantity Demanded, and Quantity Supplied, respectively. Step 3: Complete questions 1 & 2. 1. Compute shortage and surplus at each price by subtracting quantity demanded from quantity supplied. First, enter the heading "Shortage/Surplus" in cell D1. Then, move your cursor to cell D2, enter"= C2-B2," and hit the return key. Next, place the cursor on D2, hold down the mouse button and move to D11, then release the button. 2. Graph the demand & supply schedules based on the instructions in the video above. Note: • Price is generally drawn on the vertical axis. • Quantity demanded and quantity supplied: represented on the horizontal axis. Step 4: Answer questions 3 - 6. Step 5: Now, create a new demand schedule which has 2000 more demanded at each price. First, enter the heading "New Demand" in cell E1. Then, enter =B2+2000 in cell E2 and hit the return key. Next, place the cursor on E2, hold down the mouse button and move to E11, then release the button. Now you can use the new demand schedule and the original supply schedule to derive a new Shortage/Surplus column. First, enter the heading "New Shortage/Surplus" in cell F1. Then, move your cursor to cell F2, enter"= C2-E2," and hit the return key. Next, place the cursor on F2, hold down the mouse button and move to F11, then release the button. Now, provide your responses to Question 7a - 7c. Step 6: To plot the New Demand curve go to the original graph and right-click anywhere in the chart, and "Select Data," and then click "Add" in the Select Data Source window that opens. For the "Series name," place your cursor on E1 to select "New Demand." For the "Series X values," select cells E2 down to E11 (new demand curve), and for the "Series Y values," select cells A1 down to A11 (original prices). Now you have a graph showing all three curves. Step 7: Now, graphically show the old and new equilibrium positions. Step 8: Make sure to label your axes and the appropriate scales for each axis. For help:
Expert Answer:

Related Book For 

Principles of Macroeconomics
ISBN: 978-0134078809
12th edition
Authors: Karl E. Case, Ray C. Fair, Sharon E. Oster
Posted Date:
Students also viewed these marketing questions
-
The accompanying table shows the supply and demand schedules for used copies of the second edition of this textbook. The supply schedule is derived from offers at Amazon.com. The demand schedule is...
-
Table shows supply and demand schedules for the British pound. Assume that exchange rates are flexible. a. The equilibrium exchange rate equals____. At this exchange rate, how many pounds will be...
-
The following are the assumed supply and demand schedules for hamburgers in College town: a. Plot the supply and demand curves and indicate the equilibrium price and quantity. b. What effect would a...
-
Suppose that you are holding your toy submarine under the water. You release it and it begins to ascend. The graph models the depth of the submarine as a function of time. What is the domain and...
-
The following data represent the afternoon high temperatures for 50 construction days during a year in St. Louis. a. Construct a frequency distribution for the data using five class intervals. b....
-
Aim is a sole trader who does not keep a full set of accounting records. An analysis of his bank transactions is shown below on the left. Aims other assets and liabilities were as stated below:...
-
Three parallel-plate capacitors each store the same amount of charge. Capacitor 1 has a plate area \(A\) and a plate separation \(d\). Capacitor 2 has a plate area \(2 A\) and a plate separation...
-
Your division is considering two investment projects, each of which requires an up-front expenditure of $25 million. You estimate that the cost of capital is 10 percent and that the investments will...
-
i. As at 30th June 2013, the following information was available from the records of SGR Limited. ii. Acheque of sh 2,720,000 drawn on 30th June was presented to the bank for payment on 16th July,...
-
The following data relate to the operations of Shilow Company, a wholesale distributor of consumer goods: Current assets as of March 31: Cash $ 8,000 Accounts receivable 20,000 Inventory 36,000...
-
Which of the following is a precipitation reaction? a. 2 LiI(aq) +Hg 2 (NO 3 ) 2 (aq) ?Hg 2 I 2 (s) + 2 LiNO 3 (aq) b. NaCl(aq) + LiI(aq)? NaI(aq) + LiCl(aq) c. HCl(aq) + KOH(aq)? KCl(aq) + H 2 O(l)...
-
A soccer ball player bounces the ball off her head, changing the velocity of the ball. She changes the x-component of the velocity of the ball from Vix = 8.4 m/s to vfx 3.8 m/s and the y-component...
-
This tool reports search volume data and provides data on search impressions, clicks, and more. O Fetch as Google O Google Search Console O Google Ads O Google Tag Manager With what algorithm update...
-
a . Sam has recently moved to a rural area in a very foreign country. This country does not use the Metric System of Measurement and does not use the Imperial System of Measurement. The national...
-
On a ship, an object of "D (Kg)" weight is suspended by two steel rods of equal length making an angle of "a" with the horizontal. The diameters of the rods are "d (cm)". The object is in balance.)...
-
A particle with mass of 2.95 kg is acted on by a force F acting in the x-direction. If the magnitude of the force varies in time as shown in the figure below, determine the following. Fx (N) 8 6 4 1...
-
2 Kramerica Company has a small plant worth $8,000. The plant is subject to physical damages and total destruction as a result of fire. From over 20,000 industry observations, the firm has derived...
-
Critical reading SAT scores are distributed as N(500, 100). a. Find the SAT score at the 75th percentile. b. Find the SAT score at the 25th percentile. c. Find the interquartile range for SAT scores....
-
For a developing country to grow, it needs capital. The major source of capital in most countries is domestic saving, but the goal of stimulating domestic saving usually is in conflict with...
-
When Bill Clinton took office in January 1993, he faced two major economic problems: a large federal budget deficit and high unemployment resulting from a slow recovery from the recession of 1990 to...
-
Explain why stabilization policy may be difficult to carry out. How is it possible that stabilization policies can actually be destabilizing?
-
A wind turbine works by slowing the air that passes its blades and converting much of the extracted kinetic energy to electric energy. A large wind turbine has 45-m-radius blades. In typical...
-
You are pulling a child in a wagon. The rope handle is inclined upward at a 60 angle. The tension in the handle is 20 N. How much work do you do if you pull the wagon 100 m at a constant speed?
-
A typical muscle fiber is 2.0 cm long and has a cross-section area of 3.1 10-9 m 2 . When the muscle fiber is stimulated, it pulls with a force of 1.2 mN. What is the work done by the muscle fiber...

Study smarter with the SolutionInn App