TipTop Flight School offers flying lessons at a small

Transcribed Image Text:
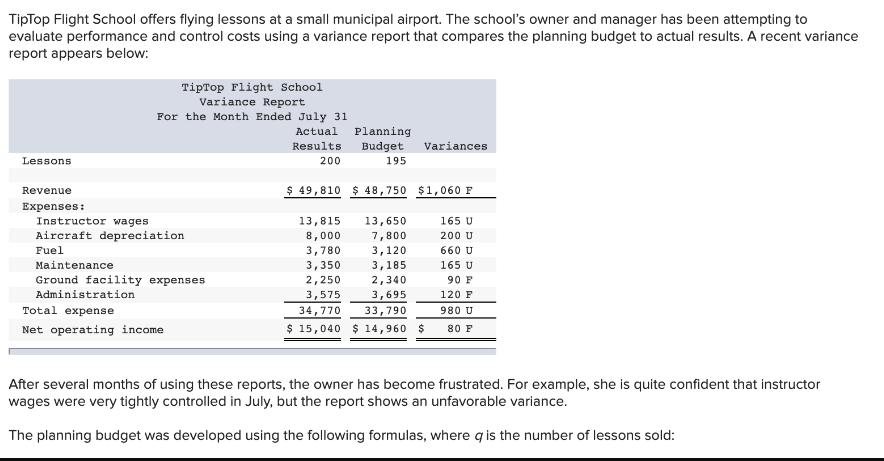
TipTop Flight School offers flying lessons at a small municipal airport. The school's owner and manager has been attempting to
evaluate performance and control costs using a variance report that compares the planning budget to actual results. A recent variance
report appears below:
TipTop Flight School
Variance Report
For the Month Ended July 31
Actual Planning
Results. Budget
200
Variances
Lessons
195
Revenue
$ 49,810 $ 48,750 $1,060 F
Expenses:
Instructor wages.
13,815
13,650
165 U
Aircraft depreciation
8,000
7,800
200 U
Fuel
3,780
3,120
660 U
Maintenance
3,350
3,185
165 U
Ground facility expenses
2,250
2,340
90 F
Administration
3,575
3,695
120 F
Total expense
34,770
33,790
980 U
Net operating income
$ 15,040 $ 14,960 $
80 F
After several months of using these reports, the owner has become frustrated. For example, she is quite confident that instructor
wages were very tightly controlled in July, but the report shows an unfavorable variance.
The planning budget was developed using the following formulas, where q is the number of lessons sold: Cost Formulas.
Revenue
$250g
Instructor wages.
$70g
$40g
Aircraft depreciation
Fuel
$16g
Maintenance
$650 +
$13g
$1,950
$2g
Ground facility expenses
Administration
$3,500+ $1g
Required:
2. Complete the flexible budget performance report for the school for July. (Indicate the effect of each variance by selecting "F" for
favorable, "U" for unfavorable, and "None" for no effect (i.e., zero variance). Input all amounts as positive values.)
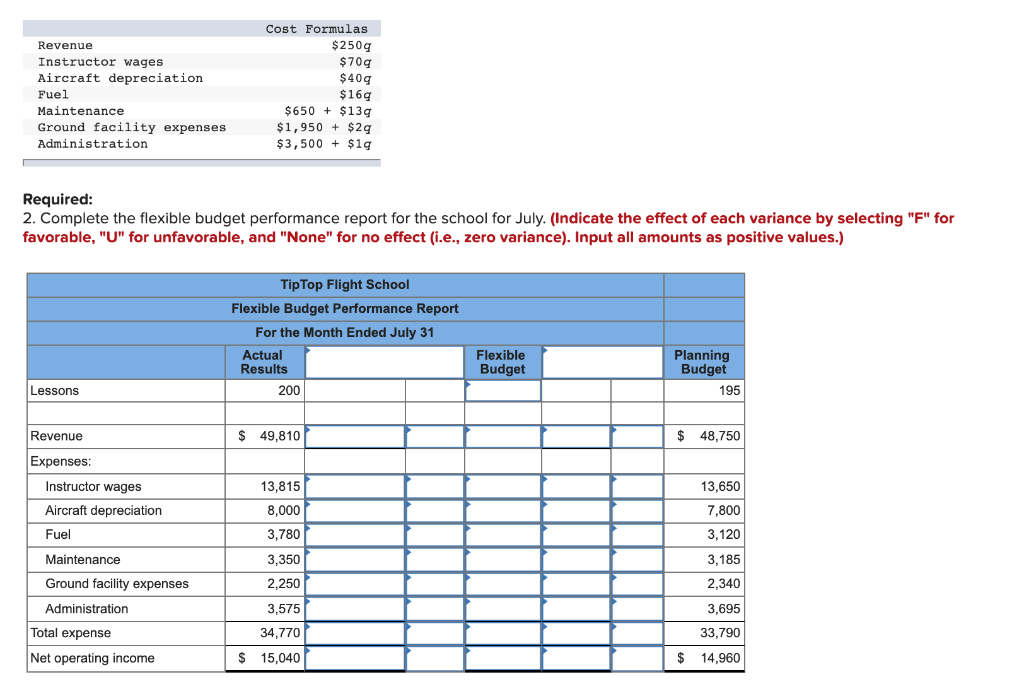
TipTop Flight School
Flexible Budget Performance Report
For the Month Ended July 31
Actual
Flexible
Budget
Planning
Budget
Results
Lessons
200
195
Revenue
$ 49,810
$ 48,750
Expenses:
13,815
13,650
8,000
7,800
3,780
3,120
3,350
3,185
2,250
2,340
3,575
3,695
34,770
33,790
$ 15,040
$ 14,960
Instructor wages
Aircraft depreciation
Fuel
Maintenance
Ground facility expenses
Administration
Total expense
Net operating income