

The demand for Famous Idaho Potato Bowl tickets (in Boise) is shown below. The marginal cost of
Question:
The demand for Famous Idaho Potato Bowl tickets (in Boise) is shown below. The marginal cost of supplying seats is zero up to Albertsons Stadium's capacity of 30,000.
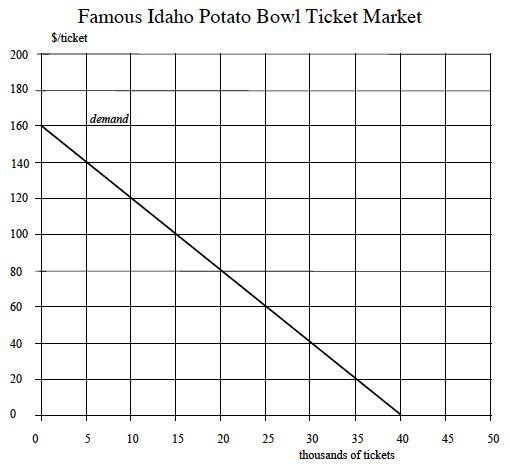
(a) Suppose the Famous Idaho Potato Bowl manager decides to maximize profit. What happens? Illustrate your answer. Now suppose Idaho governor decides to control the ticket price according to the principle of perfect competition. Then, what happens?
(b) Suppose that the fixed cost of putting on the Famous Idaho Potato Bowl is $1.5 million, and suppose that the gate is the Bowl’s only revenue. What is the profit in both cases above? Comment on the implications of your results for the choice between monopoly and competitive pricing; compare your conclusion to the economist’s traditional preference for competition.
(c) What is the elasticity of demand at a price of $100? At the profit-maximizing price? At the competitive price?
Question 2.
Make a statistical study of professional football (NFL) and baseball (MLB) revenue and performance using 2015 data. The data derive from tables at http://www.forbes.com/lists (Links to an external site.)Links to an external site., http://www.mlb.com (Links to an external site.)Links to an external site., http://www.nfl.com (Links to an external site.)Links to an external site.. Spreadsheets are posted online as spreadsheets nfl15.xlsx and mlb15.xlsx, or as pdf files nfl15.pdf and mlb15.pdf.
(a) First consider the distribution of winning percentage ratios. For each league what is its mean, median, standard deviation, maximum and minimum ratios? Make a table of your answers. Comment on differences.
(b) For each league plot revenue versus performance; put performance on the horizontal axis. Add trendlines to your plots. Describe the hypothesis underlining these regression models.
(c) Obtain the regression coefficients and R2
(d) Compare the two leagues with respect to regression goodness-of-fit, the meaning of the estimated parameters and the statistical importance of the relationship. Discuss the difference between these two leagues as observed in these regressions. What factors account for this difference?
Expert Answer:
Question 1 a If the Famous Idaho Potato Bowl manager decides to maximize profit then the price charged per ticket will be set at the quantity where the demand and the supply curves intersect This pric... View the full answer


Probability and Statistics
ISBN: 978-0321500465
4th edition
Authors: Morris H. DeGroot, Mark J. Schervish
