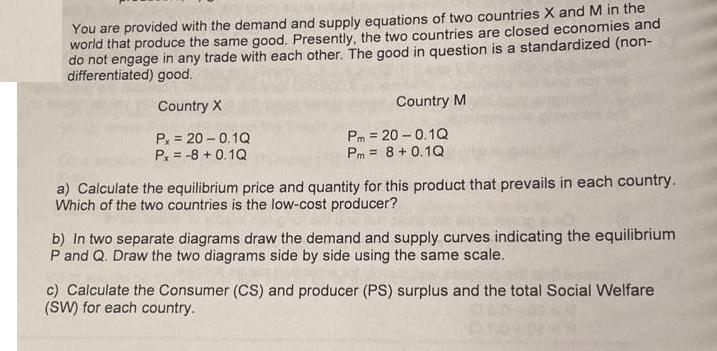
You are provided with the demand and supply equations of two countries X and M in...
Fantastic news! We've Found the answer you've been seeking!
Question:
Transcribed Image Text:
You are provided with the demand and supply equations of two countries X and M in the world that produce the same good. Presently, the two countries are closed economies and do not engage in any trade with each other. The good in question is a standardized (non- differentiated) good. Country X Px = 20-0.1Q Px = -8 +0.1Q Country M Pm=20-0.1Q Pm = 8 +0.1Q a) Calculate the equilibrium price and quantity for this product that prevails in each country. Which of the two countries is the low-cost producer? b) In two separate diagrams draw the demand and supply curves indicating the equilibrium P and Q. Draw the two diagrams side by side using the same scale. c) Calculate the Consumer (CS) and producer (PS) surplus and the total Social Welfare (SW) for each country. Now, suppose that the two countries have decided to open themselves up to free trade with each other. Suppose that given the sum of their demand and supply curves, assuming zero transportation costs, that the world demand and supply equations are given by World: Pw=20-0.05Q and P=0+ 0.05Q d) Calculate the equilibrium world price and quantity for this product that will prevail once the two countries have settled in their open trade relationship with each other. e) At the new world price (Pw) calculate what will happen to the quantity demanded (Qa) and quantity supplied (Qs) in each country. Which country will become the exporter (have a surplus) and which the importer (have a shortage) of this good? Calculate the amount of the good exported by one and imported by the other country. It will help you if you draw on your two diagrams the new price and pinpoint graphically the new quantities demanded and supplied in each country. f) Calculate the new Consumer (CS) and producer (PS') surplus and the total Social Welfare (SW') for each country now that they have opened up to trade. g) What has been the change on the CS, PS and SW in the exporting country? Who gains and who loses (consumers or producers)? Is the country as a whole better or worse off? h) What has been the change on the CS, PS and SW in the importing country? Who gains and who loses (consumers or producers)? Is the country as a whole better or worse off? i) What is the change in the World Social Welfare (WSW SWx+ SWm). Are both countries together in a better or worse position than before? You are provided with the demand and supply equations of two countries X and M in the world that produce the same good. Presently, the two countries are closed economies and do not engage in any trade with each other. The good in question is a standardized (non- differentiated) good. Country X Px = 20-0.1Q Px = -8 +0.1Q Country M Pm=20-0.1Q Pm = 8 +0.1Q a) Calculate the equilibrium price and quantity for this product that prevails in each country. Which of the two countries is the low-cost producer? b) In two separate diagrams draw the demand and supply curves indicating the equilibrium P and Q. Draw the two diagrams side by side using the same scale. c) Calculate the Consumer (CS) and producer (PS) surplus and the total Social Welfare (SW) for each country. Now, suppose that the two countries have decided to open themselves up to free trade with each other. Suppose that given the sum of their demand and supply curves, assuming zero transportation costs, that the world demand and supply equations are given by World: Pw=20-0.05Q and P=0+ 0.05Q d) Calculate the equilibrium world price and quantity for this product that will prevail once the two countries have settled in their open trade relationship with each other. e) At the new world price (Pw) calculate what will happen to the quantity demanded (Qa) and quantity supplied (Qs) in each country. Which country will become the exporter (have a surplus) and which the importer (have a shortage) of this good? Calculate the amount of the good exported by one and imported by the other country. It will help you if you draw on your two diagrams the new price and pinpoint graphically the new quantities demanded and supplied in each country. f) Calculate the new Consumer (CS) and producer (PS') surplus and the total Social Welfare (SW') for each country now that they have opened up to trade. g) What has been the change on the CS, PS and SW in the exporting country? Who gains and who loses (consumers or producers)? Is the country as a whole better or worse off? h) What has been the change on the CS, PS and SW in the importing country? Who gains and who loses (consumers or producers)? Is the country as a whole better or worse off? i) What is the change in the World Social Welfare (WSW SWx+ SWm). Are both countries together in a better or worse position than before?
Expert Answer:
Related Book For
Macroeconomics Principles And Policy
ISBN: 9780324586213
11th Edition
Authors: William J. Baumol, Alan S. Blinder
Posted Date:
Students also viewed these economics questions
-
You are provided with the following information taken from Washburne Inc.s March 31, 2012, balance sheet. Cash ..................... $ 11,000 Accounts receivable ............... 20,000 Inventory...
-
You are provided with the following information taken from Items Inc.s May 31, 2014, balance sheet. Cash ..................... $19,000 Accounts receivable.............. 47,600...
-
You are provided with the following information about Eldon Corp.: i. Accounts receivable on December 31, 2017 = $287,500. ii. Sales during the year ended December 31, 2017 = $2,262,500 (all sales...
-
L-keys, such as the one shown in the figure below, are commonly used to insert screws and bolts in medical implants. This insertion process can be simplified into the loading scenario shown in the...
-
On January 3, 2011, Haskins Corporation acquired 40 percent of the outstanding common stock of Clem Company for $990,000. This acquisition gave Haskins the ability to exercise significant influence...
-
Slapshot Company makes ice hockey sticks. On June 1, Slapshot had $42,000 of materials in inventory. During the month of June, the company purchased $180,000 of materials. On June 30, materials...
-
Consider the following cash flow diagram. What is the value of \(X\) if the internal rate of return is 15 percent? a. \(\$ 246\) b. \(\$ 255\) c. \(\$ 281\) d. \(\$ 290\) 0 $400 X X 1 2
-
You are auditing payroll for the Morehead Technologies Company for the year ended October 31, 2011. Included next are amounts from the client's trial balance, along with comparative audited...
-
You are director of HRM (international) for an international firm operating mainly in Africa. The business strategy is to expand operations into the Far East, starting in Malaysia. A number of...
-
VF Corporation is an apparel company that owns recognizable brands like Timberland, Vans, Reef, and 7 For All Mankind. Exhibit 5.18 and 5.19 present balance sheets and income statements,...
-
Monty appreciates the company discount he is given, and he believes in what the company is selling. What influence is having the greatest effect on Monty?
-
List advantages and disadvantages of the Uniform Construction Index (UCI) coding system.
-
If your credit cards APR is 24% compounded daily, what is the effective annual interest rate that you are paying?
-
Which business enterprises pay untaxed profits to owners/partners who then pay the taxes on their individual returns?
-
What is meant by contractor O & P? Give three components that are considered in the O & P.
-
Find the yearly depreciation of a $100,000 five-year class concrete mixer, first assuming that it is new when purchased, and then that it is purchased as used equipment.
-
Jessica's house sells for $235,000 and she pays a 6% real estate commission to the listing broker, Oscar. Oscar keeps 55% and gives the co-operating broker the balance of the sales commission. If...
-
Experiment: Tossing four coins Event: Getting three heads Identify the sample space of the probability experiment and determine the number of outcomes in the event. Draw a tree diagram when...
-
Explain in words why rising prices reduce the multiplier effect of an autonomous increase in aggregate demand.
-
Use the concept of opportunity cost to explain why velocity is higher at higher interest rates.
-
Why do you think wages tend to be rigid in the downward direction?
-
A radar has the following parameters: peak power \(P_{t}=50 \mathrm{~kW}\); total losses \(L=5 \mathrm{~dB}\); operating frequency \(f_{0}=5.6 \mathrm{GHz}\); noise figure \(F=10 \mathrm{~dB}\) pulse...
-
A radar generates \(100 \mathrm{~kW}\) of power and has \(1 \mathrm{~dB}\) of loss between the power tube and the antenna. The radar is monostatic with a single antenna that has a gain of \(38...
-
Starting with Eq. (3.94), derive Eq. (3.95), assume \(u_{0}=2 \mathrm{~cm}^{-1}\). In your analysis you may assume that \(\left(4 \pm \frac{1}{\lambda^{2}}ight) \approx 4\). Equation (3.94) Equation...
Study smarter with the SolutionInn App