

In a study, a researcher measures the preference of men and women for two brands of frozen
Question:
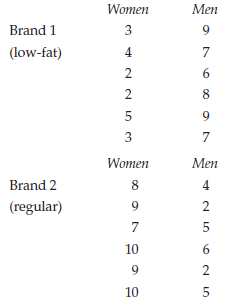
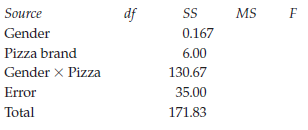
a. Complete the ANOVA summary table. (If your instructor wants you to calculate the sums of squares, use the preceding data to do so.)
b. Are the values of Fobt significant at α = .05? At α = .01?
c. What conclusions can be drawn from the F-ratios?
d. What is the effect size, and what does this mean?
e. Graph the means.
Fantastic news! We've Found the answer you've been seeking!
Step by Step Answer:
a Source df SS MS F Gender 1 0167 0167 0095 Pizza Brand 1 600 600 343 Gender x Pizza 1 13067 13067 7...View the full answer

Answered By
PU Student
cost accounting
financial accounting
auditing
internal control
business analyst
tax
i have 3 years experience in field of management & auditing in different multinational firms. i also have 16 months experience as an accountant in different international firms. secondary school certification.
higher secondary school certification.
bachelors in mathematics.
cost & management accountant
4+ Reviews
10+ Question Solved
Related Book For 
Research Methods And Statistics A Critical Thinking Approach
ISBN: 9781305257795
5th Edition
Authors: Sherri L. Jackson
Question Posted:
