The signal at the input of an AM receiver is u(t) = m 1 (t) cos(20t) +
Question:
The signal at the input of an AM receiver is u(t) = m1(t) cos(20t) + m2(t) cos(100t) where the messages mi(t), i = 1, 2 are the outputs of a low-pass Butterworth filter with inputs
x1(t) = r(t) ? 2r(t ? 1) + r(t ?2), and x2(t) = u(t) ? u(t ??4)
respectively. Suppose we are interested in recovering the message m1(t). The following is a discretized version of the required filtering and demodulation.
(a) Consider xi (t) and x2(t) pulses of duration 5 seconds and ?generate sampled signals x1 (nTs) and x2(nTs) with 512 samples. Determine Ts.
(b) Design a 10th order low-pass Butterworth filter with half- power frequency of 10 (rad/sec). Find the frequency response H(j?) of this filter using the function freqs for the frequencies?
obtained for the discretized Fourier transforms obtained in the previous item. From the convolution property Mi
Mi(?) = H(j?) Xi(?), i = 1,2
?(c) To recover the sampled version of the desired message m1(t), first use a band-pass filter to keep the desired signal containing m1(t) and to suppress the other. Design a band-pass Butterworth filter of order 20 with half-power frequencies ?? = 15 and ?u = 25 rad/sec so that it will pass the signal m1(t) cos(20t) and reject the other signal.
(d)?Multiply the output of the band-pass filter by a sinusoid cos(20 nTs)(exactly the carrier in the transmitter used for the modulation of m1(t)), and low-pass filter the output of the mixer (the system that multiplies by the carrier frequency cosine). Finally, use the previously designed low-pass Butterworth filter, of bandwidth 10 (rad/sec) and order 10, to filter the output of the mixer. The output of the low-pass filter is found in the same way we did before.
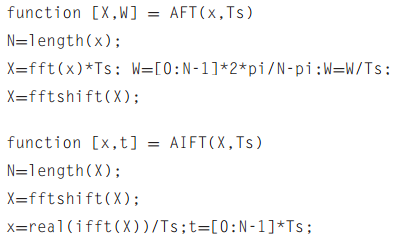
(e)?Plot the pulses xi(nTs), i = 1, 2, their corresponding spectra and superpose the magnitude frequency response of the low-pass filter on the spectra. Plot the messages mi(nTs), i = 1, 2, and their spectra. Plot together the spectrum of the received signal and of magnitude response of the band-pass filter. Plot the output of the band-pass filter and the recovered message signal. Use the function plot in these plots.Use the following functions to compute the Fourier transform and its inverse.
Step by Step Answer:
Figure 76 Pr 716 clear all clf signal generation Ts5512 t10 Ts1Ts t21 ...View the full answer