

Children living near a smelter in Texas were exposed to lead, and their IQ scores were subsequently
Question:
Children living near a smelter in Texas were exposed to lead, and their IQ scores were subsequently measured. The following histogram was constructed from those IQ scores.
Figure 3.11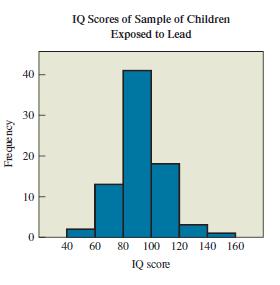
a. Estimate the frequency for each of the six score categories.
b. Estimate the total number of children included in the histogram.
c. What are the lowest and highest possible IQ scores included in the histogram?
d. How does the shape of the histogram change if relative frequencies are used instead of frequencies
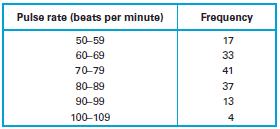
Pulse Rates of Females. In Exercises, refer to the following frequency table of pulse rates of a sample of females.
Fantastic news! We've Found the answer you've been seeking!
Step by Step Answer:
a Y axis shows the frequencies of each categories th...View the full answer

Answered By
Marvine Ekina
Marvine Ekina
Dedicated and experienced Academic Tutor with a proven track record for helping students to improve their academic performance. Adept at evaluating students and creating learning plans based on their strengths and weaknesses. Bringing forth a devotion to education and helping others to achieve their academic and life goals.
PERSONAL INFORMATION
Address: , ,
Nationality:
Driving License:
Hobbies: reading
SKILLS
????? Problem Solving Skills
????? Predictive Modeling
????? Customer Service Skills
????? Creative Problem Solving Skills
????? Strong Analytical Skills
????? Project Management Skills
????? Multitasking Skills
????? Leadership Skills
????? Curriculum Development
????? Excellent Communication Skills
????? SAT Prep
????? Knowledge of Educational Philosophies
????? Informal and Formal Assessments
0 Reviews
10+ Question Solved
Related Book For 

Statistical Reasoning For Everyday Life
ISBN: 978-0134494043
5th Edition
Authors: Jeff Bennett, William Briggs, Mario Triola
Question Posted:
