

Consider the graph of the normal distribution in Figure 5.12, which gives relative frequencies in the distribution
Question:
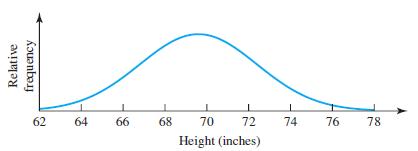
Consider the graph of the normal distribution in Figure 5.12, which gives relative frequencies in the distribution of men’s heights. The distribution has a mean of 69.6 inches and a standard deviation of 2.8 inches.
a. What is the total area under the curve?
b. Estimate (using area) the relative frequency of values less than 67 inches.
c. Estimate the relative frequency of values greater than 67 inches.
d. Estimate the relative frequency of values between 67 and 70 inches.
e. Estimate the relative frequency of values greater than 70 inches
Fantastic news! We've Found the answer you've been seeking!
Step by Step Answer:
a The total area under the curve of a normal distribution is always equal to 1 b To estimate the rel...View the full answer

Answered By
Dulal Roy
As a tutor, I have gained extensive hands-on experience working with students one-on-one and in small group settings. I have developed the ability to effectively assess my students' strengths and weaknesses, and to customize my teaching approach to meet their individual needs.
I am proficient at breaking down complex concepts into simpler, more digestible pieces, and at using a variety of teaching methods (such as visual aids, examples, and interactive exercises) to engage my students and help them understand and retain the material.
I have also gained a lot of experience in providing feedback and guidance to my students, helping them to develop their problem-solving skills and to become more independent learners. Overall, my hands-on experience as a tutor has given me a deep understanding of how to effectively support and encourage students in their learning journey.
0 Reviews
10+ Question Solved
Related Book For 

Statistical Reasoning For Everyday Life
ISBN: 978-0134494043
5th Edition
Authors: Jeff Bennett, William Briggs, Mario Triola
Question Posted:
