Discuss the chart in Figure 2.4b. Why does it show actual incomes rather than incomes as a
Question:
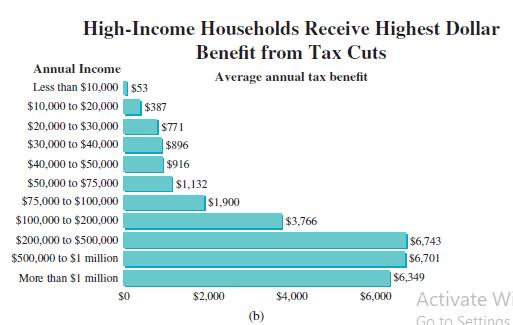
Discuss the chart in Figure 2.4b. Why does it show actual incomes rather than incomes as a percentage of all taxpayers? What does it tell us about the effects of the tax cuts on each income level?
Do you think it supports the claim in its title? Defend your opinion.
Figure 2.4b
Transcribed Image Text:
High-Income Households Receive Highest Dollar Benefit from Tax Cuts Annual Income Average annual tax benefit Less than $10,000 s53 |$387 |S771 $896 $10,000 to $20,000 $20,000 to $30,000 $30,000 to $40,000 $40,000 to $50,000| $916 $50,000 to $75,000 $1,132 $75,000 to $100,000 S1,900 $100,000 to $200,000 $3,766 $6,743 $6,701 $200,000 to $500,000 $500,000 to $1 million More than $I million $6,349 Activate Wi $2,000 $4,000 $6,000 Go to Settings
Fantastic news! We've Found the answer you've been seeking!
Step by Step Answer:
Answer rating: 54% (11 reviews)
It shows actual incomes rather than incomes as a percentage of all taxpayers because it is a snapsho...View the full answer

Answered By

Labindao Antoque
I graduated in 2018 with a Bachelor of Science degree in Psychology from Dalubhasaan ng Lungsod ng San Pablo. I tutored students in classes and out of classes. I use a variety of strategies to tutor students that include: lecture, discussions about the subject matter, problem solving examples using the principles of the subject matter being discussed in class , homework assignments that are directed towards reinforcing what we learn in class , and detailed practice problems help students to master a concept. I also do thorough research on Internet resources or textbooks so that I know what students need to learn in order to master what is being taught in class .
0.00
0 Reviews
10+ Question Solved
Related Book For 

Statistical Reasoning For Everyday Life
ISBN: 978-0134494043
5th Edition
Authors: Jeff Bennett, William Briggs, Mario Triola
Question Posted:
Students also viewed these Sciences questions
-
Why would increased spending as a percentage of GDP on, say, household appliances or education in a particular economy be regarded as economically desirable? Why, then, is there so much concern about...
-
You hold a portfolio of securities which have had the following annual returns: {5%, 10%, -11%, 0%, 22%, 9%}. What is the geometric mean of the returns? Select one: a. 5.348% b. 3.98% c. -1.239% d....
-
What does polarization tell us about the nature of light?
-
When the freed slave saw the real physical object? A) He was perplexed by the object when he was told what they were B) He was dazzled by the light C) He didn't believe what he was told D) all adove...
-
CFG Company has the following employees: Wages Paid Eddie $12,000 Melanie 6,000 Shelly 22,000 CFG receives the maximum credit for state unemployment taxes. What is the FUTA tax that CFG Company would...
-
This year Burchard Company sold 40,000 units of its only product for $25 per unit. Manufacturing and selling the product required $200,000 of fixed manufacturing costs and $325,000 of fixed selling...
-
Consider the Amprian path going through the collection of current-carrying wires in Figure 28.19. If the magnitude of the current is the same in all the wires, is the line integral of the magnetic...
-
An assistant on the Carter Company audit has been working in the revenue cycle and has compiled a list of possible errors and fraud that may result in the misstatement of Carter Companys financial...
-
QUESTION FOUR The increasing demand in risk management on the part of organizations has been identified as a general societal trend emphasizing public accountability and responsibility. State and...
-
Income is to be evaluated under four different situations as follows: a. Prices are rising: (1) Situation A: FIFO is used. (2) Situation B: LIFO is used. b. Prices are falling: (1) Situation C: FIFO...
-
Distinguish between absolute and relative difference. Give an example that illustrates how we calculate a relative difference.
-
Distinguish between the absolute error and the relative error in a measurement. Give an example in which the absolute error is large but the relative error is small and another example in which the...
-
On February 10, Kelm secured a loan for $6,000 from Ms. Joan Williams. Kelm told Williams that the loan was to finance a real estate transaction. Five days later, Ms. Williams received a check drawn...
-
The following table shows the investments of SP Ltd, which are classified into three sub-categories. Assumptions: (a) Returns are independently and normally distributed. (b) Each category is treated...
-
Explain the rationale for the accounting treatment of compound financial instruments under IAS 32. Do you agree with IAS 32s stance?
-
During 2007, the U.S. economy was hit by a price shock when the price of oil increased from around $60 per barrel to around $130 per barrel by June 2008. While inflation increased during the fall of...
-
Scenario A A Co acquired a controlling interest in B Co and entered into the following transactions on acquisition date, 1 July 20x3. Required: Prepare the journal entries that A Co would record to...
-
Some Federal Reserve officials have discussed the possibility of increasing interest rates as a way of fighting potential increases in expected inflation. If the public came to expect higher...
-
Multiply or divide as indicated. Reduce any common factors to simplify. a. b. c. d. x+1 (X +2)(X-3) X2-X-2 x2-8x+15 x2-9 x2-4x-5
-
Fill in each blank so that the resulting statement is true. 83 + 103 = ______ .
-
The daily circulation of the Wall Street Journal is currently 2.09 million (the largest in the country). The daily circulation of USA Today is currently 1.83 million (the second largest in the...
-
A Ridgid survey of 1,023 high school students showed that 25% of them plan to enter the field of information technology, and the margin of error is 3 percentage points. Why is it misleading to state...
-
The CEO of the Brandon Marketing Group announces that all employees must take a 5% cut in pay this year, but they will all get a 5% raise next year, so the salaries will then be the same as they are...
-
I need you guys to write it in your own words I found some answers on google but they don't work for me I need to use of own words. Thank you! please again write it in your own words! When migrating...
-
A data engineer wants to quickly set up a secure data lake. They want to import data from MySQL, PostgreSQL, Microsoft SQL Server, and Oracle databases that are running in Amazon RDS. Which service...
-
You are planning to use the SharePoint Migration Tool (SPMT). You need to migrate a SharePoint on-premises site. What should you specify to accomplish the task?

Study smarter with the SolutionInn App


