

Figure 3.37 depicts the amounts of daily oil consumption (in millions of barrels) in the United States
Question:
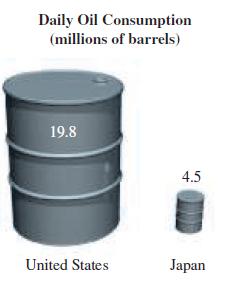
Figure 3.37 depicts the amounts of daily oil consumption (in millions of barrels) in the United States and Japan. Does the illustration accurately depict the data? Why or why not?
Fantastic news! We've Found the answer you've been seeking!
Step by Step Answer:
Illustration does not accurately depict the data because 3 dimensional structure is u...View the full answer

Answered By
Marvine Ekina
Marvine Ekina
Dedicated and experienced Academic Tutor with a proven track record for helping students to improve their academic performance. Adept at evaluating students and creating learning plans based on their strengths and weaknesses. Bringing forth a devotion to education and helping others to achieve their academic and life goals.
PERSONAL INFORMATION
Address: , ,
Nationality:
Driving License:
Hobbies: reading
SKILLS
????? Problem Solving Skills
????? Predictive Modeling
????? Customer Service Skills
????? Creative Problem Solving Skills
????? Strong Analytical Skills
????? Project Management Skills
????? Multitasking Skills
????? Leadership Skills
????? Curriculum Development
????? Excellent Communication Skills
????? SAT Prep
????? Knowledge of Educational Philosophies
????? Informal and Formal Assessments
0 Reviews
10+ Question Solved
Related Book For 

Statistical Reasoning For Everyday Life
ISBN: 978-0134494043
5th Edition
Authors: Jeff Bennett, William Briggs, Mario Triola
Question Posted:
