

The following table lists the footprint length (in centimeters) and height (in centimeters) of 10 subjects (including
Question:
The following table lists the footprint length (in centimeters) and height (in centimeters) of 10 subjects (including both men and women).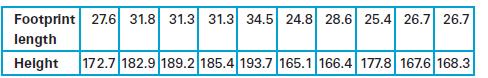
a. Use either a scatterplot or a formula for the linear correlation coefficient to determine whether there is a correlation between the two variables.
b. The first five subjects are all males and the last five are all females. For the males, use either a scatterplot or a formula for the linear correlation coefficient to determine whether there is a correlation between the two variables.
c. The first five subjects are all males and the last five are all females. For the females, use either a scatterplot or a formula for the linear correlation coefficient to determine whether there is a correlation between the two variables.
d. Do the preceding results make sense?
Step by Step Answer:
a We can create a scatterplot of the data and observe any linear relationship between the two variab...View the full answer


Statistical Reasoning For Everyday Life
ISBN: 978-0134494043
5th Edition
Authors: Jeff Bennett, William Briggs, Mario Triola
